
Gold (XAU/USD) remains under heavy pressure on Wednesday, trading near $4,055 after US President Donald Trump declared the interim ceasefire with Iran "over," triggering a sharp US Dollar rally and a surge in crude oil prices that has revived Federal Reserve rate hike bets. The technical setup confirms a bearish bias with medium confidence, though alignment across timeframes is weak: the D1 downtrend is intact, the H4 structure has resolved lower, but the H1 and shorter timeframes are compressed and deeply oversold, creating a fragile intraday state ahead of the high-impact FOMC Meeting Minutes release at 18:00 UTC. The fundamental backdrop reinforces the bearish technical view through a hawkish repricing of Fed expectations and elevated US Treasury yields, while geopolitical risk has paradoxically strengthened the Dollar rather than Gold, reflecting the metal’s current sensitivity to real yields and monetary policy outlook over its traditional safe-haven status. The narrow intraday range and oversold momentum signal coiled price action, making the event window critical for direction.
Technical Analysis
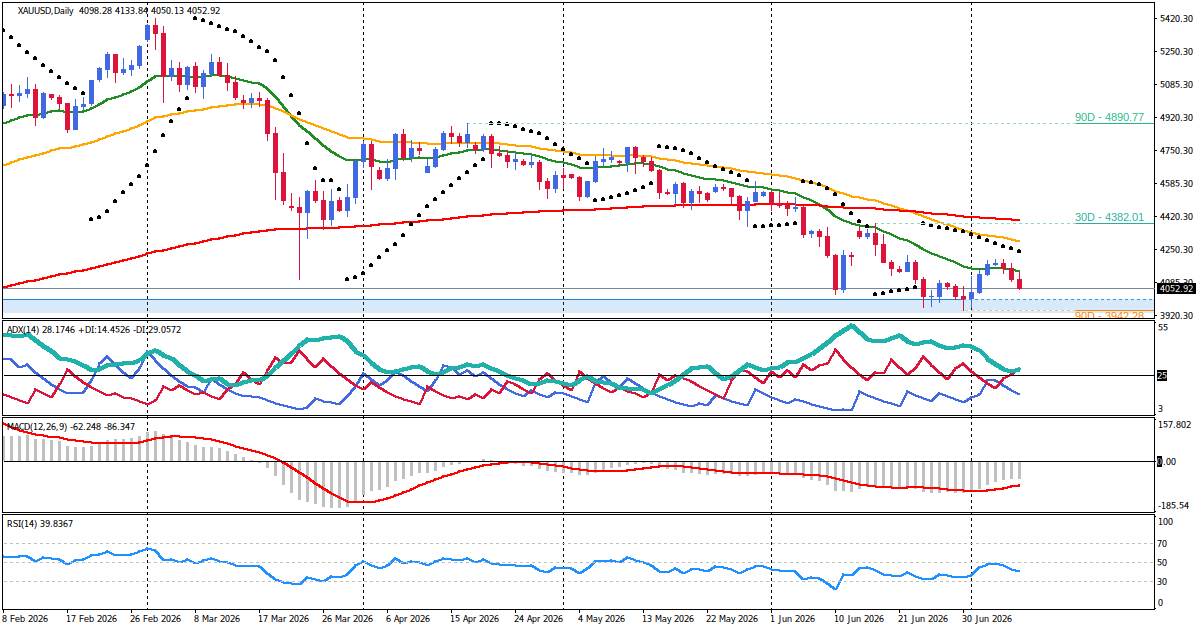
The daily timeframe shows a clear downtrend with lower highs and lower lows, reinforced by two consecutive bearish bars from the July 6 swing high at 4202.60. RSI at 42.77 supports bearish momentum, MACD is negative and declining, and ATR at 93.44 reflects high volatility. On H4, the structure resolved lower after a consolidation phase: price initially held a tight range between 4114 and 4133, then broke sharply through support, confirming the medium-term bearish context. ADX on H4 is low (15.59), indicating a non-trending state, but the directional resolution aligns with the D1 bias. The short-term picture is more conflicted. H1 shows contracting volatility and oversold momentum (RSI 28.18, Stochastic 6.79), with price contained in a 4040-4058 range before a corrective bounce to 4072 on M5. M30 is decisively bearish with ADX 41.33 and deeply oversold readings (RSI 27.62). M15 and M5 show a sharp bounce from 4041, but the move appears stretched: M5 has pushed above the upper Bollinger Band at 4065.59, and Stochastic is overbought at 82.85, suggesting the corrective bounce may be exhausted near the 4072-4085 resistance zone. Overall, the technical state is bearish at higher timeframes but fragile intraday due to compression and oversold conditions, with a high risk of event-driven volatility expansion from the looming catalyst.
Key Price Levels
The following zones are derived from swing points on D1, H4, and H1, refined with intraday structure:
- Resistance R1: 4072–4085 — the M5 high and upper Bollinger band extension; critical near-term cap for the corrective bounce.
- Resistance R2: 4092–4100 — prior D1 low and psychological area; acceptance above this zone would strengthen the alternative scenario.
- Resistance R3: 4121–4133 — H4 consolidation zone and supply area; heavy overhead resistance.
- Support S1: 4040–4050 — recent H1 and M15 low cluster; first demand zone for the bears to break.
- Support S2: 4025–4035 — prior structure and D1 swing low area.
- Support S3: 3995–4005 — psychological round number; a break here would extend the downtrend.
Fundamental Drivers
The macro backdrop strongly aligns with the bearish technical view. US President Trump’s statement that the Iran ceasefire is "over" and that he no longer wishes to engage with Tehran triggered a sharp risk-off move, but instead of boosting Gold, the US Dollar strengthened as higher oil prices fueled inflation concerns. WTI crude surged over 7% to near $73.50, rekindling fears of persistent price pressures. As a direct result, the CME FedWatch Tool now implies a 68% probability of a September rate hike, up from 58% the previous day. Higher borrowing costs weigh on non-yielding Gold, and US Treasury yields have risen accordingly, with the benchmark 10-year yield holding near 4.57%, close to its highest level since late May. The macro picture therefore reinforces the technical bearishness: the metal is caught between safe-haven demand and a hawkish monetary policy repricing, and with the Dollar bid and yields elevated, the scale is tipped firmly to the downside.
Market Sentiment and Risk Environment
Market sentiment is risk-averse following the collapse of the US-Iran memorandum, but the safe-haven flow is primarily directed into the US Dollar, not Gold. This dynamic is reflected in the inverse correlation: Gold’s traditional role as a geopolitical haven is being overridden by its sensitivity to real interest rates and the Dollar. Oil’s sharp advance has reignited "higher-for-longer" rate expectations, further pressuring the metal. The broader risk environment is fragile, with the S&P 500 and other risk assets under pressure, yet Gold is declining alongside equities — a pattern that tends to occur when monetary tightening fears dominate. The technical setup of compressed intraday ranges and stretched oversold momentum suggests the market is coiled ahead of the FOMC Minutes, with elevated event risk and potential for a volatility expansion in either direction.
Primary Scenario
The primary path is a bearish continuation. For this scenario to develop, price must reject the 4072–4085 resistance zone and break below the 4040–4050 support area, confirming that the corrective bounce from the 4041 low is complete. A breakdown would open the door to 4025–4035 and then the psychological 3995–4005 zone. The FOMC Minutes act as the likely catalyst: if the minutes confirm a hawkish stance, reinforcing the probability of a September rate hike, Gold would likely accelerate lower. The D1 and H4 structures both support this path, and the fundamental backdrop of rising yields and a strong Dollar provides consistent macro confirmation.
Alternative Scenario
The alternative scenario is a corrective extension to the upside. If the 4072–4085 resistance is broken and acceptance is achieved above 4092–4100, the bounce could extend toward the 4121–4133 supply zone. This scenario gains credibility if the FOMC Minutes are less hawkish than feared, or if oversold conditions on H1 and M30 trigger a short-covering rally. However, given the strong bearish alignment on D1 and H4 and the hawkish fundamental backdrop, this path is the less probable of the two and would require a clear catalyst to invalidate the dominant bearish structure.
Economic Calendar and Catalysts
- US FOMC Meeting Minutes (July 8, 18:00 UTC) — High impact. The minutes of the June FOMC meeting are the primary catalyst today. Markets will scrutinize the discussion around inflation, the labor market, and the path of rate hikes. Given the recent shift in rate expectations following the oil surge, any hawkish nuance could amplify Dollar gains and press Gold lower. Conversely, a less unified tone could trigger a relief bounce.
- US Unemployment Claims (July 9, 12:30 UTC) — Medium impact. Forecast 218K vs previous 215K. A significant miss could influence near-term USD direction, though the focus remains on the Fed minutes for immediate volatility.
Outlook
The balance of evidence clearly favors a bearish continuation. Technical and fundamental signals align: the daily and H4 downtrends are intact, the Dollar is strong, yields are elevated, and the Fed is seen as more likely to hike than cut. The primary confidence limiter is the compressed and oversold intraday structure, which introduces the risk of a short-covering bounce before further declines, but the broader direction remains down. The outlook is for consolidation around current levels into the FOMC Minutes, followed by a likely acceleration of the downtrend toward the 4000 area. A hawkish outcome would reinforce the dominant path; a neutral outcome could trigger a temporary corrective extension, but the resumption of the bearish trend should be anticipated unless price convincingly reclaims the 4100 region.
Disclaimer: This is not personalized financial advice. The information is for educational purposes only and does not guarantee any future outcome.


