
USD/JPY Bullish Momentum Eases into High-Impact US Data Week
The bias for USD/JPY remains bullish with high confidence, supported by strong alignment across the daily and four-hour charts. The broader trend is firmly up but now shows clear signs of exhaustion and overbought conditions, with the pair consolidating in a compressed range near the 162.00 handle. This quieting of intraday momentum comes just as a data-packed week featuring the US ISM Manufacturing PMI and Non-Farm Payrolls threatens to inject fresh volatility. The technical structure still favours continuation, but the stretched higher timeframe positioning and the event-sensitive calendar create a fragile backdrop that demands cautious interpretation.
Technical Analysis
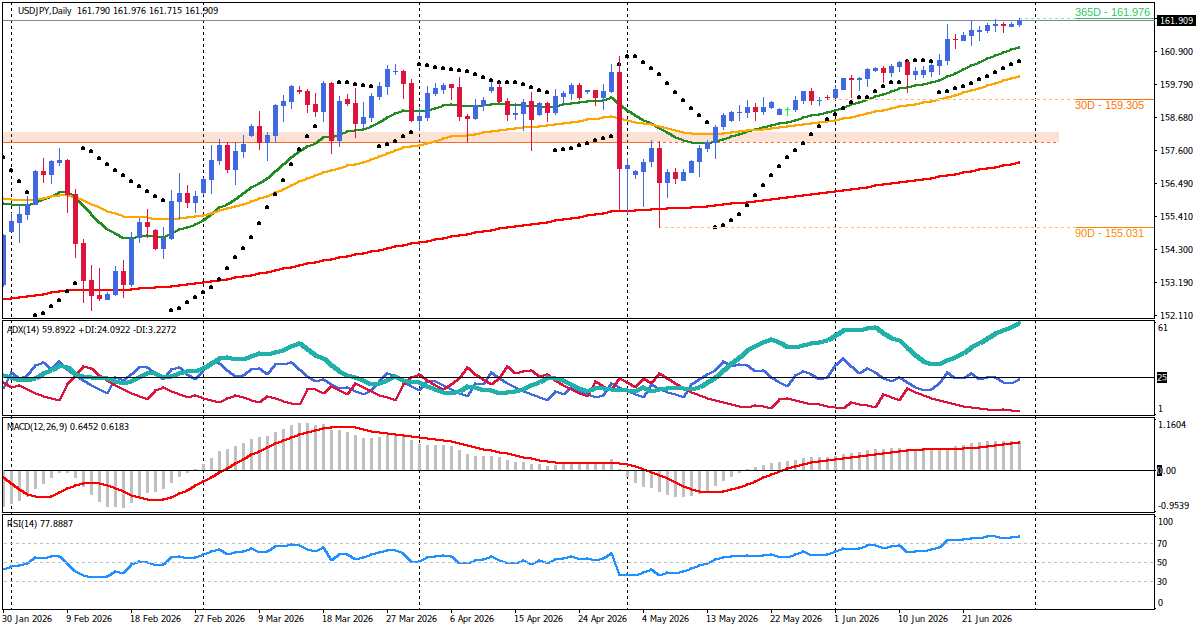
The daily chart confirms a powerful uptrend with an ADX reading of 57.36. Price is trading well above both the EMA20 at 160.940 and the EMA50 at 159.983, maintaining unambiguous bullish alignment. However, momentum indicators are starkly overbought, with the RSI at 76.65 and the Stochastic at 93.23, suggesting the trend is extended and vulnerable to consolidation or a corrective snapback. The high volatility regime, measured by an ATR of 0.535, supports the potential for large directional swings once a new catalyst emerges. The four-hour chart aligns with the daily structure, showing a strong trend (ADX 39.21) with a series of higher highs and higher lows intact. Momentum on this timeframe is also overbought, with the Stochastic at 85.94, while volatility is expanding, a condition that typically supports trend continuation. Price is currently resting just below the recent high of 161.976, and the contained range of the latest closed candles indicates a pause within the medium-term bullish framework. On the lower timeframes, the one-hour chart still shows a bullish bias but momentum is cooling (RSI 57.02, Stoch 77.22), and price has pulled back to compress near the EMA20. The M30 chart confirms this compression with a low ADX reading of 16.30 and contracting Bollinger Bands, reflecting a clear lack of short-term directional impetus. This intraday compression does not contest the broader bullish bias but rather represents a resting phase. The market is building energy, and the next directional push will likely be catalyst-driven.
Key Price Levels
- Resistance Zone 1: 161.976 - 162.000 – H4 swing high and psychological resistance.
- Resistance Zone 2: 162.200 - 162.250 – Daily Bollinger Band upper level.
- Resistance Zone 3: 162.500 - 162.600 – Fibonacci projection zone.
- Support Zone 1: 161.790 - 161.820 – Daily close area and H4 structure point.
- Support Zone 2: 161.717 - 161.750 – Daily swing low and H1 EMA50 convergence.
- Support Zone 3: 161.500 - 161.550 – Prior swing low from June 24.
Fundamental Drivers
The macro backdrop for USD/JPY is dominated by US dollar strength and diverging monetary policy paths. Markets have priced in one additional Federal Reserve rate hike this year following June’s PCE data, which eased fears of a second wave of inflation. However, the labour market remains the key variable: a resilient employment report this week could revive expectations for more aggressive tightening, further lifting the dollar. In Japan, the latest data showed unemployment holding at 2.5% in May, in line with expectations, while the jobs/applicants ratio came in slightly below forecast at 1.17 versus 1.18. These figures reinforce a stable but not accelerating labour market, giving the Bank of Japan little urgency to adjust policy. Meanwhile, ongoing speculation about the BoJ’s independence and the possibility of intervention at elevated USD/JPY levels adds a layer of caution. A decisive break above 162.00 would mark a new cycle high and could trigger negative spillovers across APAC currencies, as highlighted by BNY. The fundamental signals broadly align with the bullish technical structure, but they also underscore the risk that a softer US data set could weaken the dollar and prompt a corrective move, particularly given the stretched positioning.
Market Sentiment and Risk Environment
Broader market sentiment is cautious but not fearful. Quarter-end positioning kept most major assets in familiar ranges at the start of the week, with investors reluctant to commit ahead of the US data barrage. The US dollar is drawing support from the repricing of Fed rate expectations, while the yen remains under pressure from the persistent yield differential. Intervention fears are present but not acute, with Japanese authorities seen as unlikely to act before the payrolls release. Risk appetite is mixed: equity markets are subdued, and commodities like gold remain under pressure above $4,000, failing to mount a convincing recovery. The environment broadly supports the dollar and by extension the upside bias in USD/JPY, but the impending event risk means that sentiment can shift quickly. The technical compression into a low-volatility, quiet intraday state suggests the market is coiled, and the release of ISM or NFP data will likely determine the next leg.
Primary Scenario
The primary scenario is a bullish continuation after the current consolidation phase ends. Price maintains a position above the 161.850 support zone and eventually breaks with conviction above the 161.976 - 162.000 resistance area. A strong bullish impulse bar on the H1 or M30 timeframe closing cleanly above 162.000, supported by rising momentum indicators, would confirm this path. The structure would then target a gradual climb towards the 162.200 - 162.250 zone, with potential extension toward 162.500 - 162.600 if dollar momentum is strong. This scenario is most credible during the London/New York overlap or active New York session, and it gains additional support if US ISM data or Fed commentary reinforces hawkish expectations. The primary path would be invalidated by a daily close below the 161.717 support zone, which would break the immediate bullish structure.
Alternative Scenario
The alternative scenario is a deeper corrective move within the ongoing uptrend. This path unfolds if price fails to break and hold above 162.000 and subsequently breaks below the 161.850 near-term support structure. Confirmation would come from consecutive lower lows on the H1 and M30 timeframes accompanied by a bearish shift in momentum. The decline would target the 161.700 - 161.550 support zone, with a possible extension toward the 161.500 area. This scenario is more likely during thin liquidity conditions, such as the Asian session, or if US economic data disappoints materially, causing the dollar to weaken. A risk-off move that strengthens the yen could also accelerate the correction. The bearish path would be invalidated if price reclaims the 162.000 level with authority, negating the breakdown.
Economic Calendar and Catalysts
The active window is dominated by US-focused releases that directly impact dollar-yen dynamics. The following events carry high or medium-high significance:
- July 1 at 13:00 UTC – US Fed Chairman Warsh Speaks. High impact. Any remarks on the rate outlook or inflation could set the tone ahead of ISM.
- July 1 at 14:00 UTC – US ISM Manufacturing PMI. High impact. Forecast 53.8, previous 54.0. The details on new orders and prices will be closely watched for signals on manufacturing momentum and cost pressures.
- July 2 at 12:30 UTC – US Non-Farm Employment Change. High impact. Forecast 114K, previous 172K. This is the week’s climax and the most likely catalyst for a sustained directional move.
- July 2 at 12:30 UTC – US Unemployment Rate. High impact. Forecast 4.3%, previous 4.3%.
- July 2 at 12:30 UTC – US Average Hourly Earnings m/m. High impact. Forecast 0.3%, previous 0.3%.
These events land on a market that is technically stretched on higher timeframes and intraday compressed, creating a high-volatility cocktail. The market is likely to remain range-bound until the first significant data point, with sensitivity to any deviation from consensus.
Outlook
The balance of evidence favours continuation of the broader uptrend, but with a clear conditional bias. The technical structure is undeniably bullish, with strong alignment across daily and four-hour charts and a compression pattern that typically resolves in the direction of the dominant trend. The fundamental backdrop provides qualified support: US dollar strength is intact, but the labour market data this week will either reinforce or challenge that narrative. The main confidence limiter is the extreme overbought condition on the daily timeframe combined with high-impact event risk. A clean breakout above 162.000 on strong data would confirm the continuation path. A failure to break or a negative surprise in the data would likely trigger a corrective move toward the 161.70-161.55 zone. The market is coiled and directional clarity will arrive with this week’s US releases. Until then, the primary scenario is bullish consolidation leading to eventual continuation, but the risk of a corrective snapback remains non-trivial.
Disclaimer: This is not personalized financial advice. The information is for educational purposes only and does not guarantee any future outcome.


