
BTC/USD is currently maintaining a neutral bias with medium confidence, as the market remains locked in a range-bound structure across daily and four-hour timeframes. While an intraday recovery from the 63,800 support zone has emerged on the hourly chart, it appears corrective rather than trend-initiating, especially as the broader market absorbs recent US economic data. Technical alignment across timeframes is only moderate, with momentum indicators suggesting a period of compression and consolidation. The market is currently balanced between buyers and sellers near the mid-range, with participants showing caution ahead of upcoming US catalysts that could disrupt the current volatility regime.
Technical Analysis
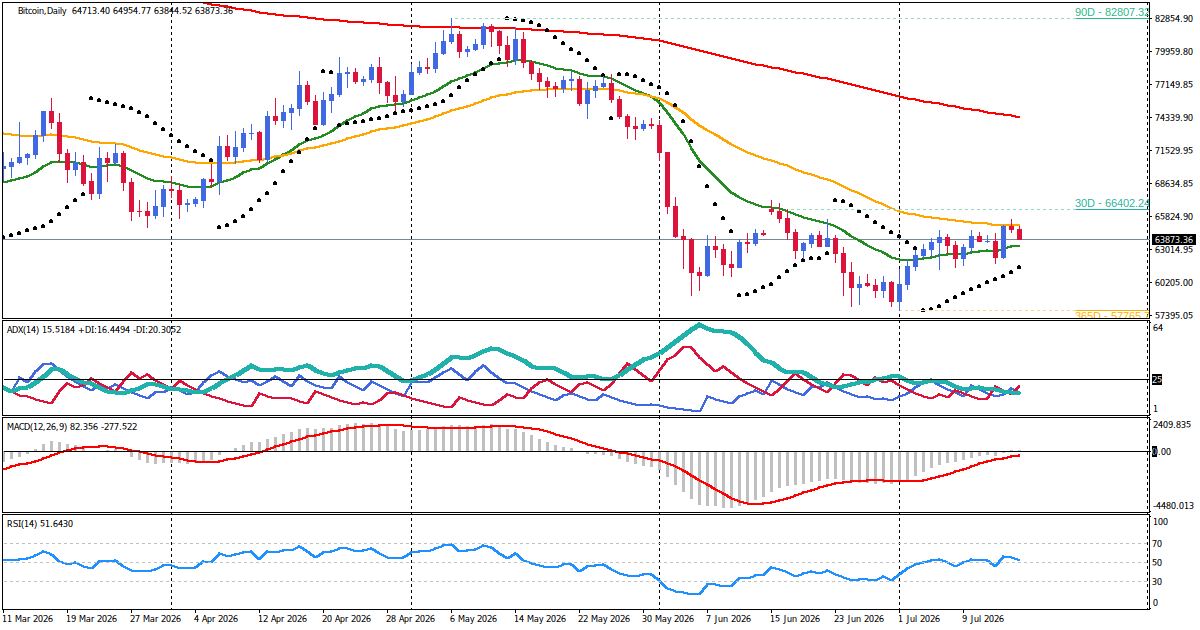
The technical structure for BTC/USD is characterized by a range-bound environment on the higher timeframes. On the daily (D1) chart, the trend is mixed with weak strength, evidenced by an ADX reading of 16.29, which confirms the absence of a trending state. Following a sharp bullish rally on July 14 that moved price from 62,292 to 65,001, the market entered a compression zone. Current price action is contained between the July 13 low of 61,781 and the July 15 high of 65,557. Momentum on the daily frame is neutral, with the RSI at 55 and the stochastic indicator reaching overbought levels at 84, suggesting limited immediate upside without a fresh catalyst.
The four-hour (H4) framework reflects a similar mixed trend but with moderate strength, indicated by an ADX of 32.88. After a decline from the 65,557 swing high to a low of 63,844 during the July 16 European session, the pair has seen a return to the mean. Bollinger Bands remain wide, and the price is currently oscillating near the midline. On the shorter intraday timeframes (H1 and M30), a clear recovery from the session low of 63,809 toward the 64,800 area is visible. However, microstructure analysis shows a slight loss of momentum as price approaches intraday resistance, indicating that the recovery lacks the conviction required to challenge the upper boundaries of the broader daily range.
Key Price Levels
- Resistance 2: 65,500 – 65,600 (Recent daily swing high from July 15)
- Resistance 1: 64,800 – 65,000 (Prior intraday swing high and psychological round number)
- Support 1: 63,800 – 64,000 (Recent hourly low and prior structural resistance)
- Support 2: 62,200 – 62,300 (July 14 swing low and primary demand area)
Fundamental Drivers
The fundamental backdrop for Bitcoin is currently shaped by the absorption of US economic data and shifting internal crypto market dynamics. Recent US reports, including Retail Sales and Unemployment Claims released at 12:30 UTC today, were largely in line with expectations. This "neutral" economic data has allowed the market to stabilize without triggering a sharp directional breakout in the US Dollar, which remains a primary driver of BTC/USD liquidity. While the data was absorbed calmly, it has reinforced a "wait-and-see" approach among institutional participants.
Within the digital asset space, there is a notable divergence in performance. Ethereum has recently outperformed Bitcoin, rising approximately 7% over the last five days compared to Bitcoin's 2% gain. Historical precedents suggest that Ethereum leading a recovery can be a precursor to a broader market move, but for now, Bitcoin remains the laggard in this recovery cycle. Additionally, corporate developments such as CleanSpark’s significant data center lease highlight ongoing institutional infrastructure growth, though these factors have yet to translate into immediate price momentum for the BTC/USD pair.
Market Sentiment and Risk Environment
Market sentiment is currently categorized as cautious and event-sensitive. The broader risk environment is stable but lacks the aggressive "risk-on" appetite needed to drive Bitcoin above major resistance levels. The market's reaction to the recent CPI-fueled surge earlier in the week has cooled, leading to the current consolidation phase. Volatility is currently at normal levels, which reduces the likelihood of sudden whipsaws but also indicates a lack of urgent buying or selling pressure. Investors are primarily focused on the upcoming US session and political commentary, which may influence dollar demand and, by extension, the appetite for high-beta digital assets.
Primary Scenario
The primary scenario is a continuation of the range-bound structure. The most likely path involves price oscillating between the support zone near 63,800 and the resistance cluster between 65,000 and 65,500. While the intraday recovery may attempt to test the upper end of this range, it is expected to encounter selling interest unless a significant shift in US Dollar sentiment occurs. This scenario remains valid as long as the price stays below the 65,500 mark. A rejection pattern on the hourly chart, such as a long wick or a bearish engulfing candle near 65,000, would confirm the persistence of this range-bound regime, leading to a potential drift back toward the 64,000 level.
Alternative Scenario
The alternative scenario is an upside breakout. This would require Bitcoin to sustain a move above the 65,500 resistance zone with strong momentum and high volume. For this path to gain credibility, a daily close above 65,500 and an increase in ADX above 25 would be necessary. Such a move would likely be catalyzed by a significant weakening of the US Dollar or a sharp increase in global risk appetite following US consumer sentiment data. In this event, the technical structure would shift toward a bullish continuation, with the next major objective situated near the 67,000 area. This scenario would be invalidated if the price quickly reverses back below the 64,800 level.
Economic Calendar and Catalysts
The following upcoming events are expected to influence USD liquidity and Bitcoin price action (all times in UTC):
- July 17, 01:00 — US: President Trump Speaks. This event could impact market sentiment and dollar volatility.
- July 17, 14:00 — US: Preliminary University of Michigan (UoM) Consumer Sentiment (Forecast: 51.0). A significant deviation from the forecast could alter expectations for US economic growth.
- July 17, 14:00 — US: Preliminary UoM Inflation Expectations (Previous: 4.6%). This is a key metric for Federal Reserve policy expectations and real yield movements.
Outlook
The outlook for BTC/USD remains one of consolidation and range retention. The balance of evidence from both technical structures and the fundamental backdrop suggests that the market is in a phase of equilibrium following the volatility seen earlier in the week. While the short-term intraday bias is tilted slightly upward, the lack of alignment across daily and four-hour timeframes limits the confidence in a sustained trend. Traders should expect two-way risk within the established 63,800 to 65,500 boundaries. The main confidence limiter remains the upcoming US economic catalysts and political speeches, which have the potential to disrupt the current quiet volatility regime and force a re-evaluation of the neutral bias.
Disclaimer: This is not personalized financial advice. The information is for educational purposes only and does not guarantee any future outcome.


