
XAG/USD exhibits a highly conflicted market structure as it trades around $60.20, trapped between a dominant daily downtrend and a sharp intraday corrective recovery. While elevated U.S. real yields near 2.23% continue to act as a primary macroeconomic headwind, recent soft U.S. manufacturing and ADP payroll data—combined with a less hawkish tone from Federal Reserve Chairman Kevin Warsh—have fueled a three-day corrective bounce. With the high-impact U.S. Non-Farm Payrolls (NFP) report scheduled for release today at 12:30 UTC, the technical alignment remains weak and highly sensitive, resulting in a mixed bias with medium confidence.
Technical Analysis
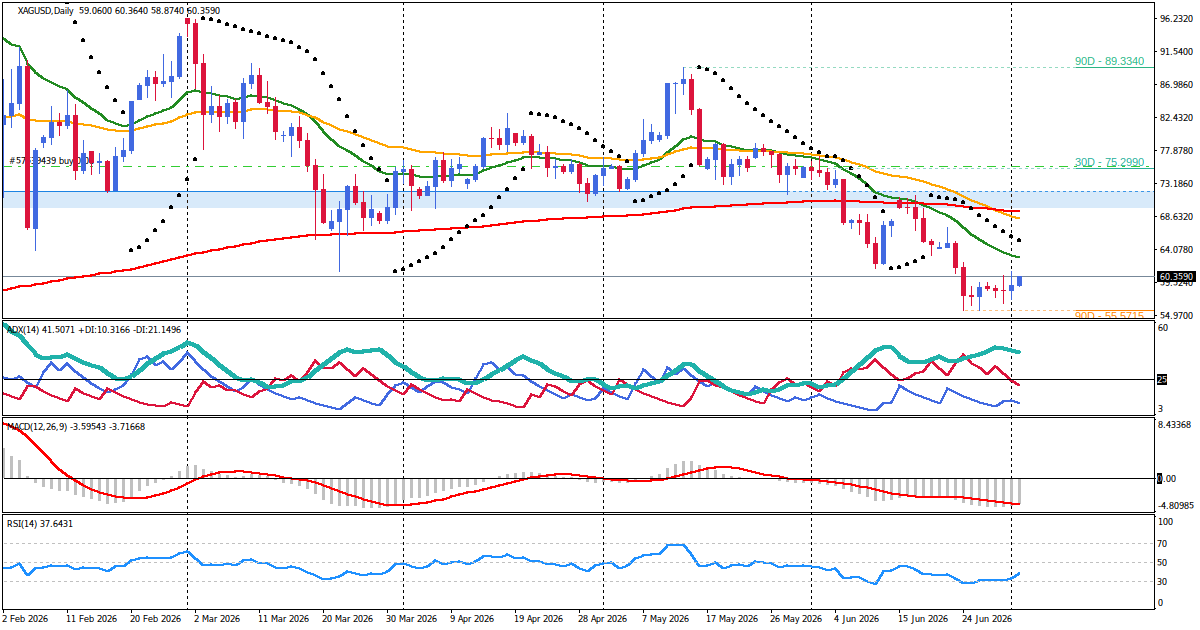
The technical posture of XAG/USD is characterized by a stark conflict between timeframes. On the daily (D1) chart, the primary trend remains strongly downward, with price action reaching an exhausted state near multi-week lows. The daily relative strength index is deeply depressed, indicating that while sellers control the broader landscape, immediate downward momentum is stretched and susceptible to corrective pullbacks. This broader bearish structure is currently being challenged by the medium-term (H4) timeframe, where momentum has shifted to a neutral stance as price undergoes a sharp corrective bounce from recent lows, pushing toward the upper boundary of its standard volatility band.
On the short-term intraday charts (H1 and M30), a moderate upward trend is active, characterized by sequential higher lows and mildly bullish momentum. The hourly timeframe is showing localized compression near the recent session highs as the London session develops, indicating that market participants are adopting a cautious, pre-event posture. Volatility remains high and expanding, reflecting significant positioning adjustments ahead of major North American liquidity injections.
Key Price Levels
The key structural zones for XAG/USD, derived from higher-timeframe swings and intraday pivot clusters, are defined as follows:
- Resistance Zone 1: 60.3000 to 60.4000 (approximate width of 1000 pips), established by recent four-hour and hourly swing highs and the upper Bollinger band.
- Resistance Zone 2: 60.8500 to 61.0000 (approximate width of 1500 pips), representing the prior daily swing high and key psychological resistance.
- Support Zone 1: 59.3000 to 59.4500 (approximate width of 1500 pips), aligned with the recent hourly swing low and the short-term exponential moving average cluster.
- Support Zone 2: 58.8500 to 59.0500 (approximate width of 2000 pips), based on four-hour structural lows and the daily opening price area.
- Support Zone 3: 57.1000 to 57.3000 (approximate width of 2000 pips), marking the multi-day low and major daily support.
Fundamental Drivers
The macroeconomic backdrop for XAG/USD represents a balance between restrictive monetary conditions and supportive physical demand. On the monetary side, the Federal Reserve maintains a steady policy stance with the Fed funds rate at 3.63% and 10-year U.S. Treasury inflation-indexed real yields hovering near 2.23%, which maintains a high opportunity cost for holding non-yielding precious metals. However, this pressure has been temporarily eased by a surprisingly less hawkish tone from Fed Chairman Kevin Warsh, who noted that while inflation remains elevated, there is no immediate urgency to raise interest rates.
Furthermore, a batch of soft U.S. economic data has cooled expectations for aggressive monetary tightening. June's ADP private payrolls grew by only 98K (missing the 113K forecast), and the ISM Manufacturing PMI ticked down to 53.3 (below the 54.0 consensus). On a structural level, silver's dual nature provides a strong valuation floor, as record industrial demand from photovoltaics, automotive, and AI applications helps offset traditional monetary headwinds.
Market Sentiment and Risk Environment
Broader market sentiment has turned more favorable for precious metals due to a sharp downturn in the global energy market. Crude oil benchmarks have slid significantly as supply anxieties eased, driven by a rapid recovery in maritime traffic through the Strait of Hormuz and diplomatic progress between Washington and Tehran. This reduction in geopolitical risk premiums has been accompanied by a softer U.S. Dollar, allowing silver to gain ground for a third consecutive day. Nonetheless, the overall sentiment remains highly fragile and sensitive to today's U.S. labor market releases, which could quickly re-ignite dollar strength if the data surprises to the upside.
Primary Scenario
The primary scenario assumes that the broader daily downtrend reasserts itself as the corrective intraday recovery exhausts near major resistance ahead of, or during, the high-impact U.S. data release.
- Bias: Bearish
- Structural Trigger: Rejection-at-zone near the upper boundary of the intraday range.
- Confirmation Needed: A clean hourly close below immediate short-term support (59.3000 to 59.4500).
- Structure Path: Price fails to sustain breakout momentum above Resistance Zone 1, rotating back down through the intraday compression area toward Support Zone 2.
- Key Zones: Resistance Zone 1 (60.3000 to 60.4000) and Support Zone 1 (59.3000 to 59.4500).
- Invalidation Condition: Acceptance above Resistance Zone 1 on a sustained four-hour candle close.
Alternative Scenario
The alternative scenario outlines a continuation of the intraday recovery, where buyers successfully break through immediate resistance to extend the corrective bounce toward major daily supply areas.
- Bias: Bullish
- Structural Trigger: Break-and-retest of the immediate intraday resistance ceiling.
- Confirmation Needed: A strong hourly candle close above Resistance Zone 1, followed by a successful retest of that zone as support.
- Structure Path: Price clears the near-term range ceiling, establishing a new support base and rallying toward Resistance Zone 2.
- Key Zones: Resistance Zone 1 (60.3000 to 60.4000) and Resistance Zone 2 (60.8500 to 61.0000).
- Invalidation Condition: A rapid failure and drop back below the intraday support zone.
Economic Calendar and Catalysts
The economic calendar for today, 2 July 2026, is dominated by high-impact U.S. labor market data, which will serve as the primary catalyst for both the U.S. dollar and precious metals:
- Today 12:30 UTC: US Non-Farm Employment Change (Forecast: 114K, Previous: 172K)
- Today 12:30 UTC: US Average Hourly Earnings m/m (Forecast: 0.3%, Previous: 0.3%)
- Today 12:30 UTC: US Unemployment Rate (Forecast: 4.3%, Previous: 4.3%)
- Today 12:30 UTC: US Unemployment Claims (Forecast: 219K, Previous: 215K)
These releases represent the most significant event risk of the week. Weak labor data would likely reinforce the less hawkish Federal Reserve outlook, driving real yields lower and supporting the alternative bullish scenario. Conversely, a strong employment print could rapidly revive hawkish Fed expectations, triggering a sharp bearish reversal in line with the primary trend.
Outlook
The outlook for XAG/USD remains highly uncertain, characterized by an unstable two-way risk profile. While the short-term technical recovery has been supported by softer U.S. data and a less hawkish tone from Fed Chair Warsh, the broader daily trend remains firmly bearish and stretched. The balance of evidence suggests that while a temporary consolidation or corrective bounce is underway, the primary downward momentum is highly likely to reassert itself unless today's U.S. Non-Farm Payrolls print weak enough to force a structural repricing of the U.S. yield curve. Given the low confluence quality and high execution risk, market participants should prepare for heightened volatility around the 12:30 UTC release.
Disclaimer: This is not personalized financial advice. The information is for educational purposes only and does not guarantee any future outcome.


