
The broader trend in USD/CAD remains bullish across the daily and four-hour timeframes, supported by strong momentum and high volatility. However, the daily chart is deeply overbought, and intraday price action has entered a consolidative phase, creating a tension between the structural uptrend and short-term exhaustion risks. With a dense cluster of high-impact US data – including the ISM Manufacturing PMI and the Non-Farm Payrolls report – the market is positioned for potential volatility expansion rather than a clean directional move. The fundamental backdrop, featuring a strong US Dollar, a dovish Bank of Canada, and USMCA trade uncertainty, broadly aligns with the bullish technical bias, but the overbought condition and event proximity cap conviction at medium.
Technical Analysis
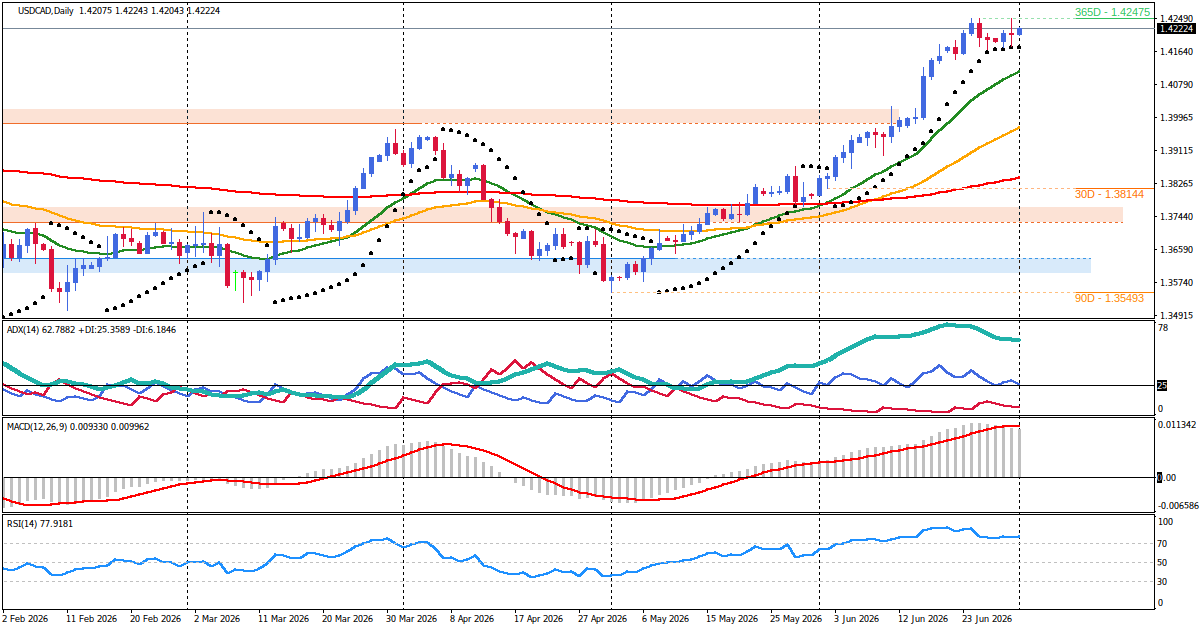
The daily chart confirms a strong uptrend with an ADX reading of 63.10, though the RSI at 76.77 signals an overbought and mature trend phase. The most recent closed daily candle displayed a wide range between 1.41773 and 1.42470, indicating aggressive buying and high volatility. On the four-hour chart, the trend is established but less extreme, with an ADX of 28.57 and price trading in the upper half of the Bollinger Bands. Recent four-hour action shows a bounce from the 1.42100 area but lacks a fresh breakout impulse, suggesting the market is consolidating beneath the 1.42470 resistance.
The intraday picture diverges from the higher timeframes. The one-hour chart exhibits a weak uptrend with an ADX of just 19.36 and the Stochastic oscillator overbought at 85.73, indicating a loss of directional conviction. The M30 chart confirms a drift higher with waning momentum, while the M5 microstructure points to exhaustion with price outside the upper Bollinger Band. Overall, the intraday structure is best described as a range or shallow pullback within the larger uptrend, rather than a strong continuation pattern. This intraday weakness reduces the immediate support for the broader bullish bias and elevates the risk of a near-term correction.
Key Price Levels
- Resistance Zone 1: 1.42350 – 1.42470 – Prior daily swing high and volatility edge; a sustained breakout above this zone would signal trend resumption.
- Resistance Zone 2: 1.42600 – 1.42700 – Psychological resistance and a projected extension target above the 61.8% retracement of the 1.4791-to-1.3480 decline.
- Support Zone 1: 1.42050 – 1.42120 – H1 consolidation area and EMA confluence; a break below this zone would confirm intraday weakness.
- Support Zone 2: 1.41750 – 1.41850 – Prior H4 swing low and daily range edge; a deeper pullback target if the rejection scenario unfolds.
Fundamental Drivers
The macro backdrop for USD/CAD remains tilted in favor of the US Dollar. The Federal Reserve maintains a hawkish stance, with Chairman Warsh scheduled to speak today, and markets are pricing in further tightening. Strong US economic data – particularly the upcoming ISM Manufacturing PMI and Non-Farm Payrolls – could reinforce USD strength if they beat expectations.
On the Canadian side, the Bank of Canada is viewed as dovish, preferring to look through the current inflation spike. Trade uncertainty surrounding the United States-Mexico-Canada Agreement (USMCA) review, which was due to begin today, adds a layer of downside risk for the Canadian Dollar. ING Research highlighted that any trade renegotiation activity poses a threat to Canada and Mexico, with the Canadian Dollar also suffering from the strong USD and a dovish BoC. This fundamental configuration supports the broader bullish technical structure, as the catalysts favor further USD/CAD upside, provided the technical resistance levels are breached.
Market Sentiment and Risk Environment
Market sentiment is cautious and event-sensitive. The US Dollar continues to attract safe-haven demand amid trade policy uncertainty and global growth concerns, which directly benefits USD/CAD. The Canadian Dollar, meanwhile, is also sensitive to crude oil prices; although no specific oil data is in the immediate calendar, any decline in energy markets would add further pressure on CAD. The combination of a strong structural uptrend, high volatility, and a dense calendar of high-impact US events creates a fragile backdrop. Price action is likely to be reactive and whippy, with support and resistance levels subject to aggressive tests as economic data hits the wires.
Primary Scenario
Bullish Continuation: A sustained break and acceptance above the 1.42470 resistance zone would confirm that the broader uptrend is resuming. The structural trigger is a close above 1.42470 on the H1 or H4 timeframe, ideally followed by a retest of the broken zone from above. In this scenario, the path would lead toward the 1.42600–1.42700 resistance zone. A strong ISM Manufacturing PMI or a robust NFP report would provide the fundamental catalyst for the breakout, while a more hawkish-than-expected tone from Fed Chair Warsh could also accelerate the move. The primary scenario remains valid as long as price holds above the 1.42050 support zone after the breakout.
Alternative Scenario
Range Rejection and Pullback: If the 1.42470 resistance holds and price forms a lower high near that level, the intraday consolidation would dominate. The structural trigger is a close below 1.42050, confirming a double top or lower high pattern. This could lead to a move back toward the support zone at 1.41750–1.41850. A soft ISM reading, cautious commentary from Fed Chair Warsh, or pre-NFP positioning that limits downside momentum could facilitate this rejection. The alternative scenario would be invalidated by a clean break above 1.42500, effectively resuming the bullish path.
Economic Calendar and Catalysts
- July 1, 13:00 UTC – Fed Chair Kevin Warsh Speaks (High impact) – Will provide insights on the Fed’s policy trajectory; hawkish tone would boost USD/CAD.
- July 1, 13:00 UTC – BoC Governor Macklem Speaks (Medium impact) – Comments on inflation and trade risks could affect CAD directly.
- July 1, 14:00 UTC – US ISM Manufacturing PMI (High impact, Forecast: 53.8, Previous: 54.0) – Key gauge of US sector health; a beat above 54 would reinforce USD strength.
- July 1, 14:00 UTC – US ISM Manufacturing Prices (Medium impact, Forecast: 77.7, Previous: 82.1) – Inflation subcomponent; elevated readings may support Fed hawkishness.
- July 2, 12:30 UTC – US Non-Farm Employment Change (High impact, Forecast: 114K, Previous: 172K) – The marquee labor market release; a strong print is USD-positive.
- July 2, 12:30 UTC – US Unemployment Rate (High impact, Forecast: 4.3%, Previous: 4.3%) and Average Hourly Earnings (High impact, Forecast: 0.3% m/m).
- July 2, 12:30 UTC – US Unemployment Claims (Medium impact, Forecast: 219K, Previous: 215K) – Additional labor market signal.
Outlook
The balance of evidence continues to favor a bullish outlook for USD/CAD, supported by a clear uptrend on intermediate timeframes and a fundamental backdrop that amplifies USD strength and weighs on the Canadian Dollar. However, the overbought condition on the daily chart, the weak intraday momentum, and the dense event schedule introduce significant two-way risk. The market is poised for either a continuation breakout above 1.42470 or a corrective pullback toward 1.41750–1.41850, with the outcome largely dependent on the tone of the upcoming US data and central bank remarks. Confidence in the bullish path is medium, as the technical and fundamental signals align but the fragile intraday structure and event sensitivity require a disciplined, confirmation-based approach.
Disclaimer: This is not personalized financial advice. The information is for educational purposes only and does not guarantee any future outcome.


