
The AUD/USD currency pair is exhibiting a moderate bearish bias under live market conditions, supported by medium analytical confidence. While the dominant daily and four-hour timeframes maintain a clear downward trajectory, the short-term intraday charts have stabilized into a horizontal consolidation range. This technical slowdown is mirrored by a balanced fundamental backdrop, where a supportive Australian commodity export channel is actively offset by soft Chinese demand transmission, a firming US Dollar, and a hawkish shift in Federal Reserve policy expectations relative to a paused Reserve Bank of Australia. With a high-impact US economic calendar fast approaching, the current market compression signals a temporary pause before the next major directional expansion.
Technical Analysis
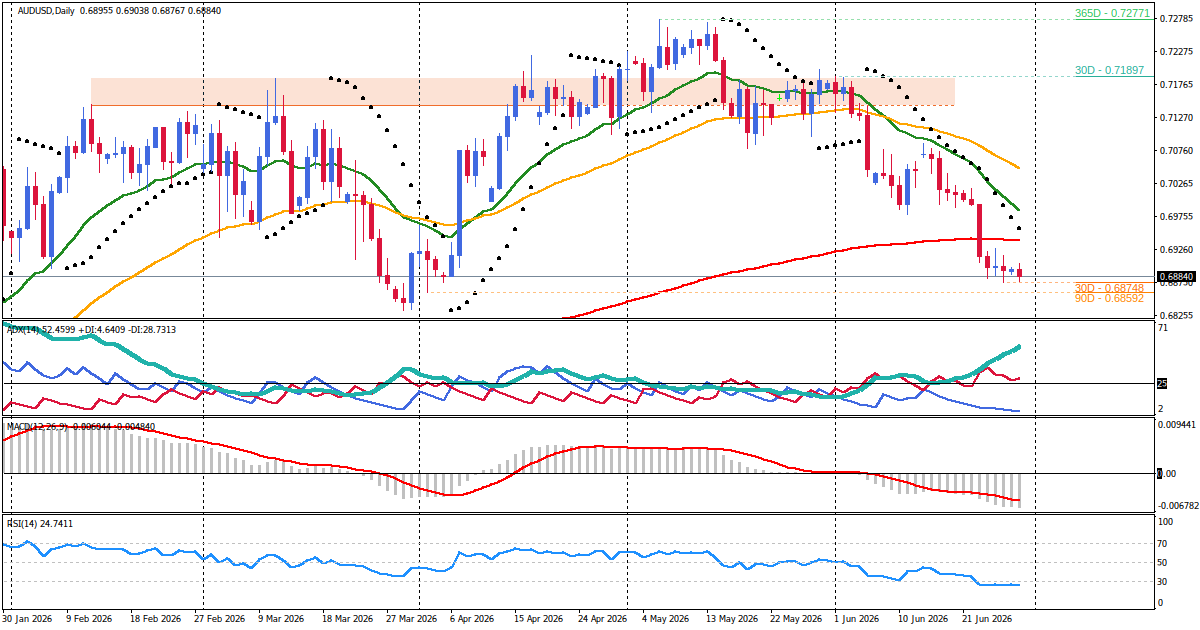
The primary trend on the daily timeframe is firmly down, characterized by strong structural momentum. However, this macro trend is showing clear signs of oversold exhaustion. The daily Relative Strength Index (RSI) has dropped to a deeply oversold reading of 25.83, while the Average Directional Index (ADX) stands at a strong 49.42. Price action has pushed toward the lower daily Bollinger Band limit near 0.68700, reflecting a highly extended swing that may struggle to find immediate downward follow-through without a prior corrective bounce.
The four-hour timeframe actively reinforces this bearish bias with moderate strength. The volatility regime on the four-hour chart is expanding, printing a series of lower highs and lower lows. The most recent four-hour candle closed at 0.68833, trading well below the middle Bollinger Band of 0.68969, which confirms that sellers retain control of the medium-term framework.
In contrast, the short-term intraday timeframes (one-hour and 30-minute) present a flat, range-bound market structure. Momentum is neutral, with the one-hour RSI hovering at 47.83 and the Stochastic indicator at 40.71. Volatility is contracting on the 15-minute timeframe, with price action tightly revolving around the one-hour 20-period Exponential Moving Average (0.68912) and the Bollinger midline (0.68911). This intraday compression indicates a temporary equilibrium between buyers and sellers, which typically precedes an explosive breakout once a catalyst emerges.
Key Price Levels
The technical market structure highlights several critical support and resistance zones based on recent swing levels and technical indicator confluences:
- Resistance Zone 1: 0.68970 to 0.69040. This zone is defined by the four-hour 20-period EMA cluster, prior four-hour swing highs, and the upper Bollinger Band on the one-hour chart.
- Resistance Zone 2: 0.69110 to 0.69170. This area marks the upper limit of the four-hour Bollinger Bands and aligns with the prior daily breakdown point.
- Support Zone 1: 0.68700 to 0.68770. This zone is supported by the daily lower Bollinger Band limit and the recent four-hour swing low.
- Support Zone 2: 0.68500 to 0.68580. A key psychological level confluent with historical daily support.
Fundamental Drivers
The fundamental backdrop for AUD/USD is characterized by a tug-of-war between supportive domestic trade data and external macroeconomic pressures. On the supportive side, Australia's commodity export channel remains a strong structural anchor. The RBA Commodity Price Index rose 16.8 percent year-over-year in May 2026, and April goods exports jumped 7.2 percent, widening the trade surplus to 2,815 million Australian Dollars. This terms-of-trade strength provides a solid underlying floor for the Australian Dollar.
However, these gains are heavily capped by weak demand transmission from China, Australia's largest trading partner. While Chinese industrial output grew by 4.5 percent in May, retail sales and fixed-asset investment contracted. Crucially, record Chinese iron ore imports are flowing directly into port inventories rather than steel production, signaling precautionary stockpiling rather than genuine demand.
Furthermore, the monetary policy momentum has shifted in favor of the US Dollar. The Reserve Bank of Australia paused its tightening cycle in June, holding the cash rate at 4.35 percent after delivering 75 basis points of hikes earlier in the year. Although RBA Governor Michele Bullock maintained a hawkish bias, the Federal Reserve also held its policy rate steady at 3.50-3.75 percent but raised its year-end dot plot projections to 3.6-4.1 percent. With markets pricing in a potential Fed rate hike by October 2026, the yield spread momentum is favoring the Greenback despite the RBA's current 60-basis-point cash rate advantage.
Market Sentiment and Risk Environment
Broader market sentiment remains supportive of the US Dollar, keeping the risk-sensitive Australian Dollar under pressure. The US Dollar Index (DXY) is trading near its 52-week high of 101.13, bolstered by persistent safe-haven demand. Ongoing geopolitical tensions in the Middle East have sustained energy inflation concerns, prompting investors to seek shelter in the liquid US Dollar. This risk-off environment directly dampens demand for the Aussie, which historically trades as a barometer of global risk appetite. The combination of compressed intraday volatility and highly sensitive risk sentiment suggests that the market is highly vulnerable to sudden, volume-driven breakout moves.
Primary Scenario
The primary scenario is a bearish continuation, aligning with the dominant higher-timeframe trend. Under this pathway, the market resolves its intraday consolidation through a downward breakout.
- Bias: Bearish
- Structural Trigger: Price acceptance below the local support at 0.68770.
- Confirmation Needed: A one-hour candle close below 0.68750 accompanied by an expanding MACD bearish histogram.
- Structure Path: A clean break below Support Zone 1, followed by a brief retest of the broken level as new resistance, leading to a deeper decline toward Support Zone 2 (0.68500 to 0.68580).
- Invalidation Condition: A four-hour candle close above 0.69040.
- Session Context: Most likely to execute during the London or New York sessions, particularly in the lead-up to or immediately following major US economic releases.
Alternative Scenario
The alternative scenario is a corrective mean reversion pullback, driven by the deeply oversold technical state on the daily chart.
- Bias: Bullish (Corrective)
- Structural Trigger: Price acceptance above the local resistance at 0.69040.
- Confirmation Needed: A one-hour candle close above 0.69050 with the one-hour RSI crossing above its 50 midline.
- Structure Path: An upward breakout from the intraday range, leading to a corrective rise toward the four-hour 50-period EMA and Resistance Zone 2 (0.69110 to 0.69170).
- Invalidation Condition: A daily candle close below 0.68700.
- Session Context: Highly sensitive to the upcoming US Federal Reserve speech and labor market data.
Economic Calendar and Catalysts
The upcoming trading week features several high-impact economic releases in the UTC calendar that are highly likely to act as catalysts for a volatility expansion:
- June 30, 12:30 UTC: Canada GDP m/m (Forecast: 0.4%, Previous: -0.1%) — Serve as a broader indicator of global growth and risk sentiment.
- July 1, 13:00 UTC: US Fed Chairman Warsh Speaks — Highly anticipated speech that could reshape near-term interest rate expectations and drive sharp USD volatility.
- July 1, 14:00 UTC: US ISM Manufacturing PMI (Forecast: 53.7, Previous: 54.0) — A vital gauge of US economic momentum.
- July 2, 12:30 UTC: US Non-Farm Payrolls & Unemployment Rate (Forecast: 114K jobs added, Unemployment Rate: 4.3%) — The premier employment report that will heavily influence the Federal Reserve's policy trajectory.
Outlook
The balance of technical and fundamental evidence for AUD/USD points to a period of near-term consolidation with an underlying bearish bias. While the daily and four-hour trends remain structurally short-biased, the extremely oversold daily RSI (25.83) and contracting intraday Bollinger Bands warn that immediate downward progress may be limited. Markets are likely to remain range-bound between 0.68700 and 0.69040 in the early part of the week as traders position themselves for the high-stakes US labor and manufacturing data. A decisive breakout of this range will depend on whether US economic indicators reinforce the Fed's hawkish optionality or trigger a corrective easing of US Dollar strength.
Disclaimer: This is not personalized financial advice. The information is for educational purposes only and does not guarantee any future outcome.


