
The USD/JPY pair remains in a complex tug-of-war between structural dollar dominance and intensifying yen defense mechanisms. Technical structure combined with the Bank of Japan’s (BoJ) recent hawkish summary of opinions supports a transitional phase where the primary bullish trend meets tactical resistance near the 160.00 psychological threshold. While the long-term trajectory remains upward, supported by the Federal Reserve's patient stance on interest rates, the immediate outlook is clouded by explicit intervention warnings from Japanese authorities and critical inflation data from Tokyo. Price action aligns with the fundamental backdrop to favor a neutral-to-bullish bias, provided that structural support levels hold against potential "bold action" from Japan’s Ministry of Finance. Investors are currently navigating a high-volatility environment where technical levels are being tested by both macroeconomic shifts and geopolitical tensions in the Middle East, necessitating a disciplined approach to risk management and position sizing.
Technical Analysis
Multi-Timeframe Market Structure
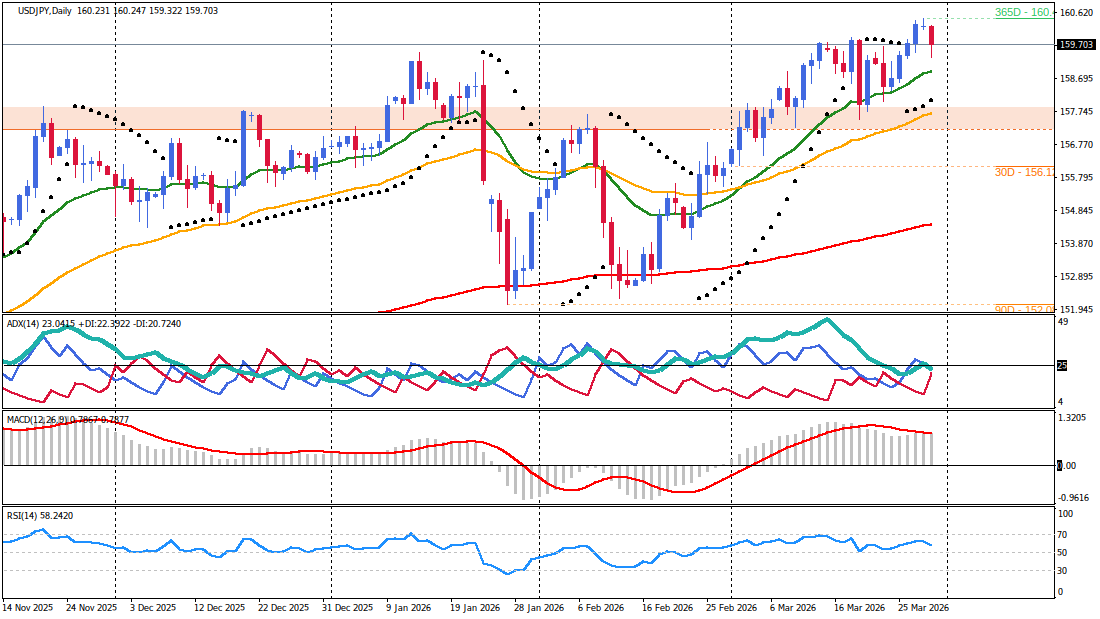
The dominant technical structure for USD/JPY remains bullish on higher timeframes, though immediate price action indicates a corrective phase. On the Daily (D1) chart, the primary trend is characterized by a clear alignment of the 20, 50, and 200-day Exponential Moving Averages (EMAs). Price continues to trade well above the 200-day EMA, confirming long-term upward momentum. However, the recent retreat from the 160.45 resistance zone suggests a cooling of overbought conditions. The 20-day EMA near 158.90 serves as the critical structural floor for the existing uptrend. Fundamental pressure from the BoJ's hawkish tilt provides the catalyst for this healthy correction within the broader bullish framework.
In the medium-term H4 framework, price is stabilizing around the 20-period EMA. Momentum is largely neutral, with the Relative Strength Index (RSI) hovering near the 50 midline. The Stochastic oscillator is currently in oversold territory, suggesting that the recent downside correction may be losing steam as buyers look for entries near structural support. The 50-period EMA at 159.36 aligns with previous horizontal congestion, providing a secondary layer of defense for bulls.
Critical Price Levels & Momentum Assessment
Short-term price action on the H1 and M30 timeframes shows consolidation within a narrow range between 159.65 and 159.80. The lack of immediate conviction reflects market participants' hesitation ahead of high-impact catalysts. Confluence is found at 159.70, which acts as the pivot for intraday direction. Momentum quality is currently classified as weak due to the divergence between overbought short-term oscillators and neutral medium-term readings. Volatility, measured by the H1 ATR, suggests a standard trading range of 15 pips per hour, though this is expected to expand significantly during upcoming data releases.
Resistance Levels:
- 160.20: Confluence of H4 Parabolic SAR and previous daily open.
- 160.45: Recent swing high and major psychological barrier.
- 160.80: Multi-year structural resistance zone.
Support Levels:
- 159.30 - 159.40: Confluence zone featuring the H1 200-EMA and H4 50-EMA.
- 158.90: Primary D1 20-period EMA trend support.
- 158.05: Daily Parabolic SAR and structural breakout point.
Fundamental Market Drivers
Central Bank Policy & Economic Outlook
The fundamental narrative is increasingly driven by the Bank of Japan’s shifting policy stance. The BoJ's March Summary of Opinions revealed a notably hawkish tilt, with one board member advocating for rate hikes "without hesitation" if economic conditions hold. Furthermore, the possibility of a larger-than-usual hike was floated to address the energy shocks stemming from the Middle East conflict. This internal pressure for tightening was underscored by Hajime Takata’s dissenting vote in favor of a 1.00% rate, contrasting with the majority's decision to hold at 0.75%. Technical structure combined with this hawkish BoJ rhetoric supports the yen's resilience at the 160.00 level.
Conversely, the US Federal Reserve maintains a patient posture. Chair Jerome Powell recently reinforced the FOMC's decision to hold rates steady between 3.50% and 3.75%, suggesting that the Fed will look through supply-driven price spikes. While the US economy remains robust, the widening gap between the Fed's "wait-and-see" majority and a dovish minority creates a backdrop of dollar stability that prevents a total collapse in USD/JPY despite Japanese intervention threats. The upcoming US labor market data, including Non-Farm Payrolls (NFP) and JOLTS Job Openings, will be critical in determining if the dollar can maintain its yield advantage over the yen.
Market Sentiment & Risk Environment
Market sentiment is currently dominated by the threat of Japanese FX intervention. Vice Finance Minister Atsushi Mimura has warned of "bold action" to counter speculative currency moves, identifying the 160.00 to 160.50 zone as a potential "red line." This verbal intervention has successfully triggered a retreat from recent highs, as traders remain wary of direct yen buying by the Ministry of Finance. Price action aligns with this fundamental backdrop, as the market hesitates to push USD/JPY significantly above 160.00 without a major catalyst.
Geopolitical risks further complicate the environment. Escalating tensions in the Middle East, particularly involving Iran and Israel, have kept oil prices elevated. As Japan is a major energy importer, high oil prices typically exert downward pressure on the yen, creating a fundamental conflict with the BoJ's tightening signals. However, the yen's status as a safe-haven asset provides some support during periods of acute market stress. This dual role of the yen—sensitive to energy costs but favored during risk-off events—contributes to the current range-bound behavior seen in the technical charts.
Integrated Trading Execution
Primary Trading Scenario
- Bias: Bullish continuation within a structural uptrend, contingent on support at the 159.65 pivot holding through the Tokyo session.
- Trigger/Entry: A clean H1 candle close above 159.85, signaling a rejection of the recent corrective pullback.
- Stop-Loss: 159.45, providing a 1.25x ATR buffer below the immediate support zone to account for high volatility.
- Profit Targets:
- Target 1: 160.20 - Alignment with H4 Parabolic SAR and structural resistance.
- Target 2: 160.45 - Retest of the recent swing high and psychological barrier.
- Session Context: Execution is preferred during the transition between the Tokyo open and the North American session, particularly following the initial reaction to Tokyo CPI data.
Alternative Market Scenario
- Invalidation: A break and sustained H1 close below the 159.30 support level, triggered by a significantly higher-than-expected Tokyo CPI print or actual FX intervention.
- Bias: Bearish reversal/deeper correction favoring yen strength.
- Trigger/Entry: Sell on a retest of 159.30 as resistance following a confirmed breakdown.
- Stop-Loss: 159.55, placed above the broken support-turned-resistance.
- Profit Targets:
- Target 1: 158.95 - Alignment with the D1 20-period EMA.
- Target 2: 158.50 - Previous reaction low and structural floor.
- Session Context: This scenario requires a fundamental catalyst, such as "decisive action" from Japanese authorities or a hawkish surprise in Japanese economic data.
Risk Management & Catalyst Analysis
Trade Risk Assessment
The primary risk to the technical setup is "whipsaw" price action during high-impact news events. The proximity of the 160.00 level makes the pair highly sensitive to verbal intervention, which can cause sudden 50-100 pip movements that ignore short-term technical indicators. Given this environment, position sizing should be reduced by half until the initial volatility from the Tokyo CPI and US JOLTS data subsides. Traders should utilize wider stop-losses, specifically the 1.25x ATR on the H1 timeframe, to avoid being stopped out by liquidity gaps during session transitions.
Economic Calendar & Event Impact
- JN Tokyo Core CPI y/y (Today, 23:30 UTC): Forecast 1.8%, Previous 1.8% - A leading indicator for national inflation; a beat will likely accelerate BoJ rate hike expectations and strengthen the JPY.
- US JOLTS Job Openings (Today, 14:00 UTC): Forecast 6.90M, Previous 6.95M - Critical for assessing US labor market tightness and Fed policy trajectory.
- US CB Consumer Confidence (Today, 14:00 UTC): Forecast 88.0, Previous 91.2 - Influences USD sentiment and expectations for domestic demand.
- US ADP Non-Farm Employment Change (April 1, 12:15 UTC): Forecast 42K, Previous 63K - A precursor to the official NFP data, impacting USD volatility.
- US Retail Sales m/m (April 1, 12:30 UTC): Forecast 0.4%, Previous -0.2% - High-impact data for assessing US consumer health.
- US ISM Manufacturing PMI (April 1, 14:00 UTC): Forecast 52.3, Previous 52.4 - Key indicator for US economic expansion and inflation in the manufacturing sector.
- US Unemployment Claims (April 2, 12:30 UTC): Forecast 212K, Previous 210K - Weekly gauge of labor market health.
- US Non-Farm Employment Change (April 3, 12:30 UTC): Forecast 56K, Previous -92K - The most significant market mover for USD/JPY; determines the medium-term trend.
Synthesized Market Outlook
The USD/JPY pair is currently in a transitional phase where the long-term bullish trend is being challenged by tactical yen intervention and a hawkish shift within the Bank of Japan. Technical structure remains supportive of higher prices as long as the 158.90-159.30 support zone remains intact. However, the 160.00-160.50 region has proven to be a formidable barrier, defended by both technical resistance and the threat of official "bold action" from Japanese authorities. The market is effectively range-bound between these two forces as it awaits the next major fundamental catalyst.
Traders should monitor the 159.70 pivot closely. Sustained trading above this level favors a retest of the yearly highs, while a break below shifts the focus to a deeper corrective move toward 158.50. The convergence of Tokyo inflation data and a heavy US economic calendar suggests that volatility will remain elevated throughout the week. A disciplined approach, prioritizing level confirmation over speculative entries, is essential to navigating the current USD/JPY landscape.


