
The USD/CAD pair enters a period of high-tension consolidation as the market prepares for a rare central bank "double-header" featuring policy decisions from both the Bank of Canada and the Federal Reserve. The technical bias remains neutral with low confidence, as price action is currently trapped within a narrowing range between significant moving averages. This technical indecision directly reflects the fundamental crossroads facing the Loonie. While Canada’s status as a net energy exporter provides a structural tailwind amid geopolitical uncertainty and oil supply risks in the Strait of Hormuz, this support is currently offset by a deteriorating domestic labor market and a sharp dip in headline inflation. Technical structure combined with the impending fundamental catalysts supports a wait-and-see approach, as the current range-bound behavior is likely to be resolved by the policy rhetoric and economic projections delivered in the upcoming sessions. Critical levels at 1.3725 and 1.3660 serve as the primary breakout triggers for the next directional trend.
Technical Analysis
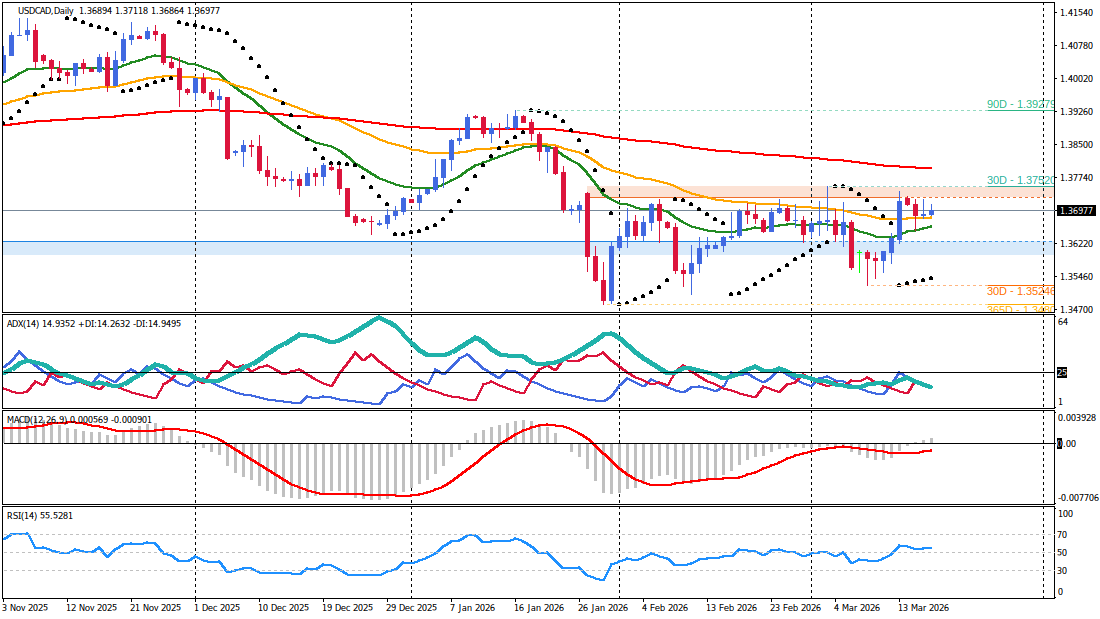
Multi-Timeframe Market Structure
The dominant structure on the daily (D1) chart reveals a lack of directional conviction. USD/CAD is currently positioned above its 50-day EMA at 1.3681 but remains capped by heavy resistance at the 200-day EMA near 1.3794. The low Average Directional Index (ADX) reading confirms a non-trending environment on the higher timeframe, suggesting the pair is in a fundamental "waiting room." This lack of trend strength on the daily chart indicates that any significant move will require a catalyst strong enough to force a close beyond these primary moving average boundaries.
On the H4 timeframe, the framework is more defined, showing an ADX above 30, which points to a moderate intraday trend. A cluster of Exponential Moving Averages (20, 50, and 200) provides a structural support floor between 1.3660 and 1.3680. While the MACD remains in positive territory, the histogram shows waning momentum as price approaches previous session highs. This divergence between H4 trend strength and D1 consolidation highlights the market's internal conflict ahead of high-impact news.
Critical Price Levels & Momentum Assessment
Intraday price action on the H1 and M30 timeframes is characterized by mean-reversion behavior. The H1 Relative Strength Index (RSI) is hovering near the 50 midline, signaling a temporary balance of power. A narrowing triangle pattern is visible on the M30 chart, with price pivoting around the 1.3700 psychological level. The momentum quality is categorized as weak due to the divergence between short-term and medium-term indicators. Technical levels currently function as flexible zones rather than rigid barriers, as volatility is expected to expand significantly during the North American session.
- Resistance Levels: 1.3722 (Previous session high), 1.3794 (D1 200-day EMA), 1.3850 (Psychological ceiling).
- Support Levels: 1.3680 (D1 50-day EMA confluence), 1.3660 (H4 EMA cluster), 1.3541 (Major structural trough).
Fundamental Market Drivers
Central Bank Policy & Economic Outlook
The Bank of Canada (BoC) is widely expected to maintain the overnight rate at 2.25% today. This "wait-and-see" approach follows a pause signaled in January, as policymakers navigate a complex landscape of domestic weakness and global volatility. The fundamental backdrop for the Loonie has softened following a dismal February employment report, which saw a decline of 84,000 jobs, primarily driven by a massive 108,000 drop in full-time positions. This represents the most significant labor market contraction since the early stages of the 2020 pandemic and provides the BoC with ample justification for a cautious, neutral stance.
Furthermore, inflation data supports the current policy pause. Headline CPI edged down to 1.8% in February, falling below the bank’s target for the first time in months. While core measures remain slightly above target at 2.3% to 2.4%, the overall trajectory suggests that inflationary pressures are cooling. The BoC’s updated macro projections, though not due for a full refresh until April, will likely emphasize the high level of uncertainty regarding energy-driven inflation and the potential impact of permanent US tariffs. The technical resistance at 1.3794 finds fundamental justification in the BoC’s neutral-to-dovish tilt, which limits CAD's ability to capitalize on higher oil prices.
Market Sentiment & Risk Environment
Market sentiment is currently dominated by the "double-header" risk. While Canada’s status as a net energy exporter usually supports the CAD during oil price spikes, the current risk-off environment driven by the US-Iran conflict has paradoxically bolstered the US Dollar as a safe haven. This creates a tug-of-war for USD/CAD. If energy prices escalate beyond $100 per barrel, the terms-of-trade benefit for Canada may eventually support the Loonie, but only if global equity markets remain stable. Currently, the risk of a North American growth slowdown and broader USD strength keeps the pair confined to its 1.3600-1.3750 range.
Integrated Trading Execution
Primary Trading Scenario
- Bias: Bullish Breakout (Low Probability) - Contingent on a dovish BoC and hawkish Fed divergence.
- Trigger/Entry: H1 candle close above 1.3725 to confirm a breakout from the M30 triangle.
- Stop-Loss: 1.3695 - Positioned below the triangle pivot with a 1.5x H1 ATR buffer.
- Profit Targets:
- Target 1: 1.3790 - Alignment with the D1 200-day EMA resistance.
- Target 2: 1.3840 - Structural swing high near the 1.3850 psychological level.
- Session Context: Execution favored during the London/NY overlap, specifically following the BoC press conference.
Alternative Market Scenario
- Invalidation: A decisive break and hold above 1.3750 or below 1.3650 on high volume.
- Bias: Mean Reversion / Range Play (Medium Probability).
- Trigger/Entry: Rejection at 1.3720 or 1.3660 supported by M30 reversal patterns (e.g., pin bars or engulfing candles).
- Stop-Loss: 20 pips beyond the entry level to account for news-driven whipsaws.
- Profit Targets:
- Target 1: 1.3690 - The mid-range point and current psychological pivot.
- Target 2: 1.3670 - Lower boundary of the H4 EMA support cluster.
- Session Context: Applicable throughout the entire New York session until the FOMC statement at 18:00 UTC.
Risk Management & Catalyst Analysis
Trade Risk Assessment
The confluence quality is currently low as technical signals are secondary to extreme event risk. The proximity of two major central bank decisions creates an environment highly susceptible to "stop-hunting" and erratic price action. Position sizing alignments suggest a reduction of at least 50% from standard risk parameters. Traders should treat technical levels as flexible zones rather than precise entry points until the market stabilizes following the FOMC press conference. The high level of uncertainty regarding energy prices and the US-Iran conflict adds a layer of unpredictable volatility that can override technical setups instantly.
Economic Calendar & Event Impact
- US Core PPI m/m (Today, 12:30 UTC): Forecast 0.3%, Previous 0.8% - Early volatility trigger for the USD side of the pair.
- CA BOC Rate Statement (Today, 13:45 UTC): No Forecast - The primary driver for CAD volatility; focus on forward guidance.
- CA Overnight Rate (Today, 13:45 UTC): Forecast 2.25%, Previous 2.25% - Expected hold; any surprise will trigger massive directional moves.
- CA BOC Press Conference (Today, 14:30 UTC): Governor Macklem’s comments on the labor market and inflation will be critical.
- US Federal Funds Rate (Today, 18:00 UTC): Forecast 3.75%, Previous 3.75% - Major risk event that could invalidate all previous intraday technical setups.
- US FOMC Press Conference (Today, 18:30 UTC): Final liquidity peak for the session; provides the closing narrative for the day.
- US Unemployment Claims (Tomorrow, 12:30 UTC): Forecast 215K, Previous 213K - Secondary impact event for USD follow-through.
- CA Retail Sales m/m (March 20, 12:30 UTC): Forecast 1.4%, Previous -0.4% - Key data for assessing Canadian consumer health post-rate decision.
Synthesized Market Outlook
The outlook for USD/CAD remains neutral-to-transitional. The technical structure aligns with the fundamental backdrop to favor range-bound trade until a clear policy divergence emerges between the BoC and the Fed. While the H4 timeframe shows some bullish inclination, the lack of daily trend strength and the significant resistance at the 200-day EMA (1.3794) suggest that gains may be capped unless the BoC adopts a surprisingly dovish tone in response to the weak employment data. Conversely, the support zone at 1.3660 is bolstered by Canada's energy exporter status, which should provide a floor unless global risk appetite collapses. Monitoring the 1.3725 resistance and 1.3660 support levels is essential; a sustained break of either, confirmed by a daily close, will likely signal the start of the next multi-week trend.


