
The NZD/USD pair currently navigates a corrective recovery phase within a broader bearish structural trend, trading near the 0.5860 level. This technical rebound aligns with a temporary softening of the US Dollar as market participants digest geopolitical developments in the Middle East and prepare for the upcoming Federal Open Market Committee (FOMC) interest rate decision. While short-term momentum on the H1 timeframe shows bullish characteristics, the overall technical bias remains neutral-bearish as price action tests significant overhead resistance at the daily EMA200. Fundamental drivers, including a sharp decline in the New Zealand Global Dairy Trade (GDT) Price Index and anticipation of a slowdown in New Zealand’s Q4 GDP growth, provide a bearish backdrop that challenges the sustainability of the current rally. With high-impact events scheduled over the next 48 hours, including the Fed’s economic projections and New Zealand’s growth data, the pair is positioned at a critical structural pivot that will determine the medium-term trajectory.
Technical Analysis
Multi-Timeframe Market Structure
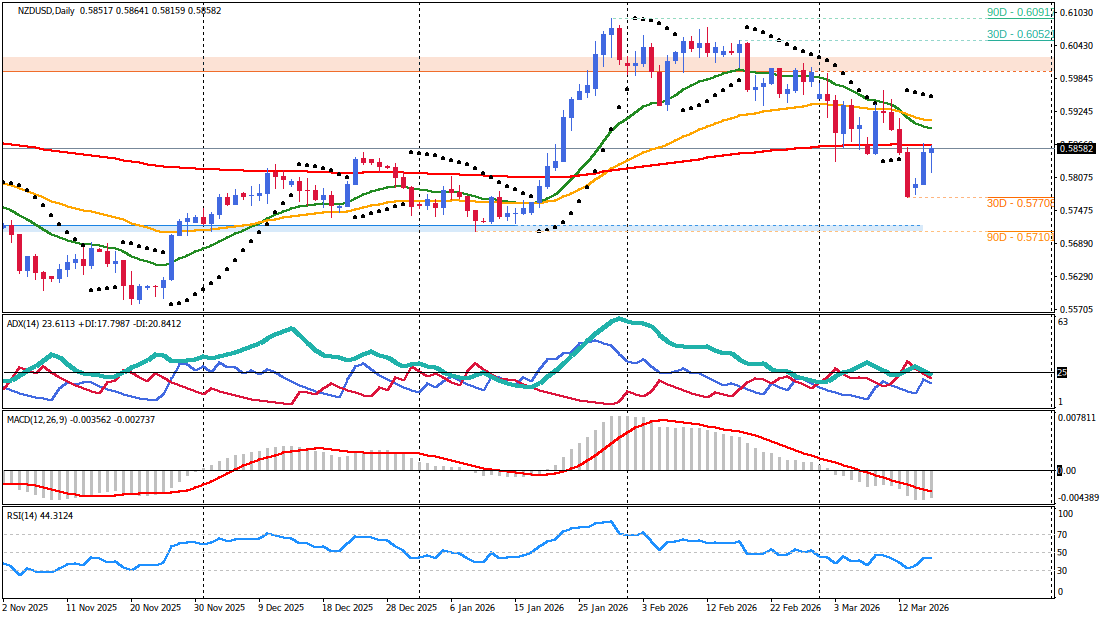
The dominant structure on the Daily (D1) timeframe remains firmly bearish. The pair continues to trade below the EMA20 and EMA50, which act as dynamic resistance levels. The current price action is testing the EMA200 at 0.5863, a level that serves as a major structural pivot. Although the Relative Strength Index (RSI) is recovering from oversold conditions, the MACD remains in negative territory, suggesting the current move is a corrective bounce rather than a structural reversal. Technical structure combined with the failure to close above the EMA200 supports a continuation of the primary downtrend toward the 0.5794 lows.
On the H4 timeframe, the secondary framework has shifted to a neutral stance. The pair is currently sandwiched between the EMA20 and EMA50, reflecting a temporary loss of directional conviction ahead of major catalysts. While the price holds above the EMA20, the Stochastic indicator is currently overbought above the 80 level, signaling that the corrective move is reaching exhaustion. The ADX remains below 20, confirming a lack of trend strength in this timeframe and favoring a range-bound environment until a breakout occurs.
The immediate intraday bias on the H1 and M30 timeframes is bullish, with price holding above the EMA20 and EMA50 cluster. This short-term strength is validated by a positive MACD histogram. However, the M30 timeframe shows signs of consolidation with a narrowing range. A breakout is imminent as the ADX rises toward 30, suggesting that volatility will expand during the London and New York sessions.
Critical Price Levels & Momentum Assessment
The technical significance of current price levels is enhanced by the proximity of fundamental catalysts. Momentum indicators are currently fragmented across timeframes, creating a transitional market phase.
- Resistance Levels:
- 0.5863: Daily EMA200 and recent high confluence, serving as the primary ceiling for the current recovery.
- 0.5870: H4 EMA50 and a psychological barrier where prior horizontal rejections have occurred.
- 0.5894: Daily EMA20, marking the primary trend resistance zone and the ultimate target for a deeper correction.
- Support Levels:
- 0.5845: A 15-pip support zone encompassing the H1 EMA50 and H4 EMA20.
- 0.5808: H4 Parabolic SAR level and recent swing support.
- 0.5794: Previous session low and major structural support.
Fundamental Market Drivers
Central Bank Policy & Economic Outlook
The fundamental narrative for NZD/USD is dominated by the divergence between the Federal Reserve and the Reserve Bank of New Zealand (RBNZ). The Federal Reserve is widely expected to maintain the Federal Funds Rate within the 3.50%-3.75% range during tomorrow's meeting. However, the focus remains on the FOMC’s updated economic projections and Chair Jerome Powell’s press conference. Any hawkish shift in the "dot plot" or commentary regarding persistent inflation—exacerbated by rising oil prices—aligns with the bearish technical structure to favor the US Dollar. Recent US labor data, specifically the NER Pulse showing a slowdown in private sector hiring to 9K jobs per week, introduces a layer of complexity to the Fed's dual mandate.
In New Zealand, the fundamental outlook is increasingly pressured. The GDT Price Index recently plummeted to 0.1% from a previous 5.7%, signaling a significant cooling in New Zealand's primary export sector. This data aligns with expectations for the Q4 GDP release, where growth is forecasted to slow to 0.4% on a quarterly basis. While the RBNZ is expected to hold rates steady at its April 8 meeting, a disappointing GDP print tomorrow could increase pressure for a more dovish policy shift later in the year. The fundamental backdrop of slowing domestic growth and falling export prices provides the "why" behind the technical resistance found at 0.5863.
Market Sentiment & Risk Environment
Risk sentiment is currently fragile due to the escalation of conflict in the Middle East. Geopolitical jitters typically drive safe-haven flows into the US Dollar, though recent remarks from US President Donald Trump regarding allied support have caused temporary volatility and a slight softening of the Greenback. The broader market remains sensitive to crude oil prices; a military escalation that threatens energy supply routes would likely trigger a risk-off environment, which historically pressures the pro-cyclical New Zealand Dollar.
Market positioning reflects this caution. The transition from a bearish H4 trend to a neutral consolidative phase suggests that traders are de-risking ahead of the FOMC. Sentiment analysis supports the technical view that unless the Fed delivers a surprisingly dovish message, the path of least resistance for NZD/USD remains to the downside as the "safe-haven" appeal of the USD persists in a high-tension geopolitical climate.
Integrated Trading Execution
Primary Trading Scenario
- Bias: Bearish rejection from structural resistance. The primary bearish D1 trend aligns with the fundamental headwinds of a declining GDT index and cautious pre-FOMC sentiment.
- Trigger/Entry: Seek a bearish M30 reversal pattern near the 0.5865 level, targeting the rejection of the 0.5863-0.5870 resistance zone.
- Stop-Loss: 0.5885, placed above the H4 EMA50 to protect against minor volatility spikes.
- Profit Targets:
- Target 1: 0.5810 - Alignment with H4 Parabolic SAR and recent swing support.
- Target 2: 0.5795 - Major structural support at the previous session lows.
- Session Context: Execution is preferred during the New York session overlap, particularly following the US PPI release but prior to the FOMC statement.
Alternative Market Scenario
- Invalidation: A sustained H1 candle close above 0.5875, which would signal a break of the H4 EMA50 and the Daily EMA200.
- Bias: Bullish corrective continuation. This scenario requires fundamental support from a significantly lower-than-expected US PPI or a dovish surprise in FOMC projections.
- Trigger/Entry: Long entry at 0.5875 on a confirmed breakout and retest of the resistance-turned-support level.
- Stop-Loss: 0.5845, below the H1 EMA50 cluster.
- Profit Targets:
- Target 1: 0.5900 - Psychological resistance and proximity to the Daily EMA20.
- Target 2: 0.5925 - Structural resistance zone on the H4 timeframe.
- Session Context: This scenario is most likely to play out post-FOMC if Chair Powell adopts a dovish tone regarding future rate paths.
Risk Management & Catalyst Analysis
Trade Risk Assessment
The proximity to high-impact economic events creates a high-risk environment for technical setups. There is a clear conflict between the bearish D1 structure and the bullish H1 intraday momentum, which suggests a "fake-out" is possible at major levels. Traders should account for potential price gaps and slippage during the FOMC announcement and the New Zealand GDP release. It is recommended to reduce position sizing by half within four hours of these major events. A stop-loss buffer of at least 15-20 pips is necessary to withstand the expected expansion in ATR during session transitions.
Economic Calendar & Event Impact
The following events are critical for NZD/USD price action. All times are in UTC:
- US Pending Home Sales m/m (Today, 14:00 UTC): Forecast -0.6%, Previous -0.8% - Provides insight into the US housing sector's resilience.
- US Core PPI m/m (Tomorrow, 12:30 UTC): Forecast 0.3%, Previous 0.8% - A leading indicator for consumer inflation; a high reading reinforces the bearish case for NZD/USD.
- US Federal Funds Rate (Tomorrow, 18:00 UTC): Forecast 3.75%, Previous 3.75% - The primary driver for USD valuation; the accompanying statement and economic projections are high-impact.
- US FOMC Press Conference (Tomorrow, 18:30 UTC): High-impact event where Chair Powell’s tone will dictate the next leg of USD momentum.
- NZ GDP q/q (Tomorrow, 21:45 UTC): Forecast 0.4%, Previous 1.1% - Critical for NZD; a miss below 0.4% will likely trigger a sharp technical breakdown toward 0.5794.
- US Unemployment Claims (March 19, 12:30 UTC): Forecast 215K, Previous 213K - Important for assessing labor market cooling.
- US Fed Chair Powell Speaks (March 21, 17:30 UTC): Provides a final wrap-up of the week's policy signals and can spark late-week volatility.
Synthesized Market Outlook
The NZD/USD pair is currently at a crossroads where technical recovery meets fundamental reality. The technical rejection at the 0.5863 EMA200 aligns with the fundamental pressures of a cooling New Zealand economy and a Federal Reserve that remains cautious about inflation. While the intraday bullishness may persist into the US PPI release, the primary bearish trend is expected to reassert itself as the market pivots toward the FOMC decision and the New Zealand GDP data. Traders should monitor the 0.5870 level as the line in the sand; a failure to break higher maintains the bearish bias toward 0.5794, whereas a sustained break above would necessitate a shift toward a more neutral-bullish corrective outlook. The confluence of geopolitical risk and central bank divergence continues to favor the downside in the medium term.


