
The AUD/USD is currently navigating a complex intersection of a corrective technical recovery and a shifting fundamental landscape. While the broader structural trend remains bearish on the daily timeframe, a sharp intraday reversal has emerged as the pair defends the 0.6830 support zone. This move is fundamentally underpinned by a softening US Dollar, driven by emerging hopes of de-escalation in the Middle East conflict following reports that the US administration may seek to wind down military campaigns. Simultaneously, the Reserve Bank of Australia (RBA) maintains a hawkish posture, with revised expectations now pointing toward three additional rate hikes in 2026 to combat inflation projected to peak at 5.4%. Technical indicators on shorter timeframes, such as the H1 and H4, show bullish momentum expansion, though the pair faces significant resistance at the 0.6900 psychological handle. Technical structure combined with the improved risk sentiment supports a short-term recovery, though the pair remains highly sensitive to a heavy cluster of high-impact US economic data scheduled for the remainder of the week.
Technical Analysis
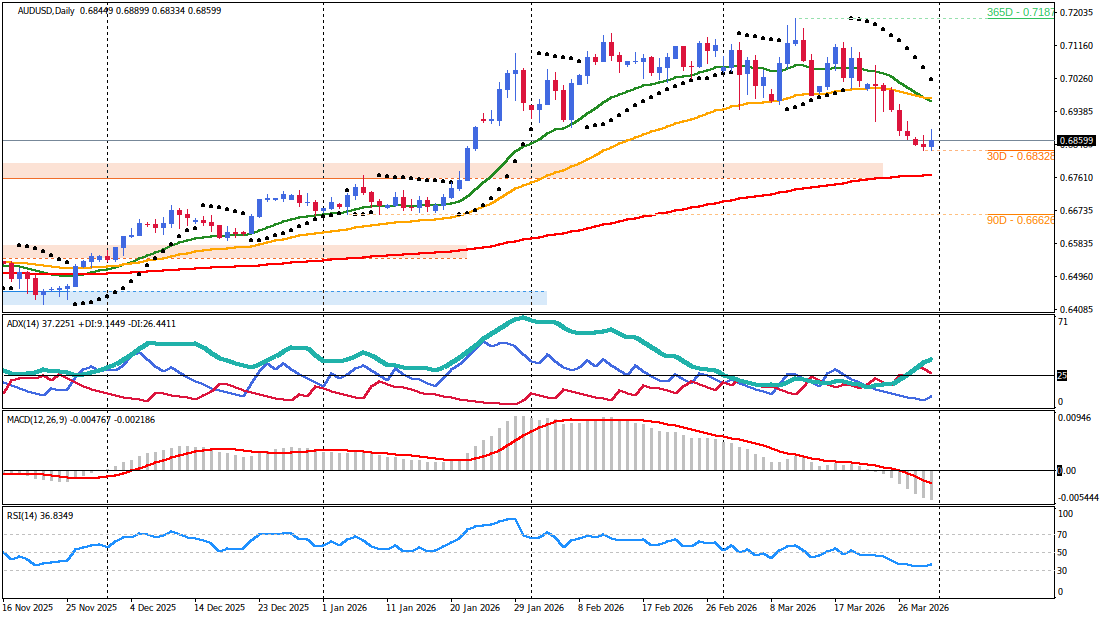
Multi-Timeframe Market Structure
The primary trend on the Daily (D1) chart remains decisively bearish, evidenced by the descending alignment of the 20, 50, and 200-period Exponential Moving Averages (EMAs). However, price action recently tagged the lower Bollinger Band at 0.6832, initiating a relief rally that aligns with fundamental shifts in risk appetite. The RSI is rising from the 30 level, suggesting technical room for a corrective advance toward the Daily EMA20 at 0.6975. This structural backdrop indicates that while the intraday bias is bullish, the move is currently classified as a correction within a larger downtrend.
On the H4 timeframe, momentum has shifted positive as price closed above the EMA20. The Average Directional Index (ADX) remains elevated at 39.21, confirming that the current reversal possesses significant force. Price is currently oscillating in the upper half of the Bollinger Band range, with the EMA50 at 0.6928 serving as the next major structural objective for buyers.
Critical Price Levels & Momentum Assessment
Intraday momentum is robust, with the H1 timeframe showing a bullish expansion where price is hugging the upper Bollinger Band. While the RSI and Stochastic indicators have entered overbought territory, the MACD histogram continues to expand in positive territory, confirming aggressive buying interest at recent lows. Fundamental drivers, specifically the easing of the US Dollar, provide the necessary tailwinds for this momentum to challenge the 0.6900 psychological resistance. A sustained breach of this level would shift focus toward the 0.6930 confluence zone, where the H4 EMA50 and H1 EMA200 converge.
Fundamental Market Drivers
Central Bank Policy & Economic Outlook
The Reserve Bank of Australia (RBA) remains a primary pillar of support for the Australian Dollar. Following a back-to-back rate hike to 4.1%, the policy outlook has turned even more hawkish. Current projections suggest the RBA will implement three additional rate hikes in May, June, and August 2026, targeting a peak cash rate of 4.85%. This aggressive stance is a direct response to Australian CPI inflation, which is now expected to peak at 5.4% in the June quarter. Despite a cut to fuel excise, food prices and broader non-energy passthrough remain significant concerns for the central bank.
The contrast between the RBA's tightening cycle and the potential for a Federal Reserve pause or shift—depending on upcoming US labor and retail data—creates a fundamental divergence that supports the technical recovery. However, the supply shock from the Middle East continues to drag on demand, with Australian GDP growth forecast to trough at 1% in 2027, which may eventually cap the Aussie's upside potential.
Market Sentiment & Risk Environment
AUD/USD has recently behaved more as a "risk asset" than a pure commodity currency, showing a 0.62 correlation with global equities (MSCI ACWI). The current rebound is largely a product of "risk-on" sentiment triggered by reports that the US is willing to wind down military campaigns in the Middle East, even if the Strait of Hormuz remains partially closed. This de-escalation narrative has allowed the US Dollar Index (DXY) to ease from ten-month highs, providing relief to risk-sensitive currencies like the AUD.
Furthermore, the price of Iron Ore—Australia's largest export—remains a critical underlying driver. While energy prices (Brent oil peaking near $120/bbl) have fueled stagflation fears, the potential for a stabilization in Chinese demand and a positive Australian trade balance provides a fundamental floor for the currency. The current technical stabilization aligns with the fundamental backdrop of easing downside risks in the geopolitical arena.
Integrated Trading Execution
Primary Trading Scenario
- Bias: Bullish intraday continuation supported by softening USD and hawkish RBA outlook.
- Trigger/Entry: Long entry on a sustained H1 candle close above 0.6905.
- Stop-Loss: 0.6878 (Positioned below the M30 EMA20 and recent value zone).
- Profit Targets:
- Target 1: 0.6930 - Confluence of H4 EMA50 and structural pivot.
- Target 2: 0.6960 - Major resistance ahead of the Daily EMA20.
- Session Context: Execution is preferred during the London open to capture liquidity, though traders must monitor the US JOLTS data for immediate volatility.
Alternative Market Scenario
- Invalidation: Failure to hold above 0.6870 or a hawkish surprise in US labor data.
- Bias: Bearish reversal if psychological resistance at 0.6900 remains defended.
- Trigger/Entry: Short entry on a bearish engulfing pattern on the M30 timeframe at 0.6900.
- Stop-Loss: 0.6925 (Above the H4 upper Bollinger Band).
- Profit Targets:
- Target 1: 0.6870 - H1 EMA20 support.
- Target 2: 0.6840 - Retest of the recent swing lows.
- Session Context: High probability if the Asian session fails to maintain momentum ahead of tomorrow's US ADP and Retail Sales data.
Risk Management & Catalyst Analysis
Trade Risk Assessment
The primary risk to the bullish scenario is the heavy concentration of high-impact US economic data. Technical levels are highly susceptible to invalidation during the US morning sessions. Given the current ATR of 21 pips on the H1, a stop-loss protocol of 1.25x ATR is recommended. Additionally, the correlation with global equities suggests that any renewed weakness in the S&P 500 or Nasdaq could trigger a "negative loop" for the AUD, regardless of domestic RBA hawkishness. Position sizes should be reduced by 50% ahead of the US ADP and Retail Sales releases.
Economic Calendar & Event Impact
- US JOLTS Job Openings (Today, 14:00 UTC): Forecast 6.89M, Previous 6.95M - A lower-than-expected figure would likely accelerate the USD softening and support the AUD rebound.
- US CB Consumer Confidence (Today, 14:00 UTC): Forecast 87.8, Previous 91.2 - Weakness here would reinforce the "risk-on" recovery for AUD/USD.
- US ADP Non-Farm Employment Change (Tomorrow, 12:15 UTC): Forecast 41K, Previous 63K - Critical leading indicator for Friday's NFP; high impact on USD volatility.
- US Core Retail Sales m/m (Tomorrow, 12:30 UTC): Forecast 0.3%, Previous 0.0% - Measures consumer strength; a beat could revive USD strength and invalidate the bullish AUD setup.
- US ISM Manufacturing PMI (Tomorrow, 14:00 UTC): Forecast 52.3, Previous 52.4 - Key indicator for US economic health and inflation via the Prices component.
- US Unemployment Claims (April 2, 12:30 UTC): Forecast 212K, Previous 210K - Ongoing labor market assessment.
- US Non-Farm Employment Change (April 3, 12:30 UTC): Forecast 63K, Previous -92K - The week's primary catalyst for long-term trend direction.
Synthesized Market Outlook
The AUD/USD is in a state of tentative stabilization. The technical breakout above the H4 EMA20 and the defense of 0.6833 provide a platform for a corrective rally, which finds fundamental support from the RBA's hawkish policy path and a temporary easing of geopolitical tensions. However, the structural downtrend remains the dominant force on the daily chart, and the 0.6930 level represents a formidable barrier that will likely require a significant fundamental catalyst to overcome. Traders should monitor the 0.6900 level closely; a failure to break higher during the upcoming US sessions would signal that the bearish trend is resuming. Conversely, a successful breach opens the path toward 0.7000, aligning with the RBA's aggressive interest rate trajectory and the potential for a sustained "risk-on" environment.


