
The USD/CAD pair exhibits a complex interplay between short-term bullish momentum and a dominant long-term bearish structure. While the US Dollar has appreciated for six consecutive sessions, reaching the 1.3650 handle, the technical structure remains capped by significant resistance zones. Technical structure combined with recent Canadian Consumer Price Index (CPI) data supports a neutral to bearish outlook as the market awaits the US FOMC Meeting Minutes. The primary narrative centers on the divergence between a Federal Reserve that remains cautious about the pace of rate cuts and a Bank of Canada (BoC) that sees inflationary pressures receding toward its 2% target. With headline Canadian inflation cooling to 2.3% and core measures hitting multi-year lows, the fundamental backdrop favors a "wait and see" approach from the BoC, while technical oscillators on lower timeframes suggest that the recent USD rally is reaching exhaustion near critical resistance at 1.3667 and 1.3692.
Technical Analysis
Multi-Timeframe Market Structure
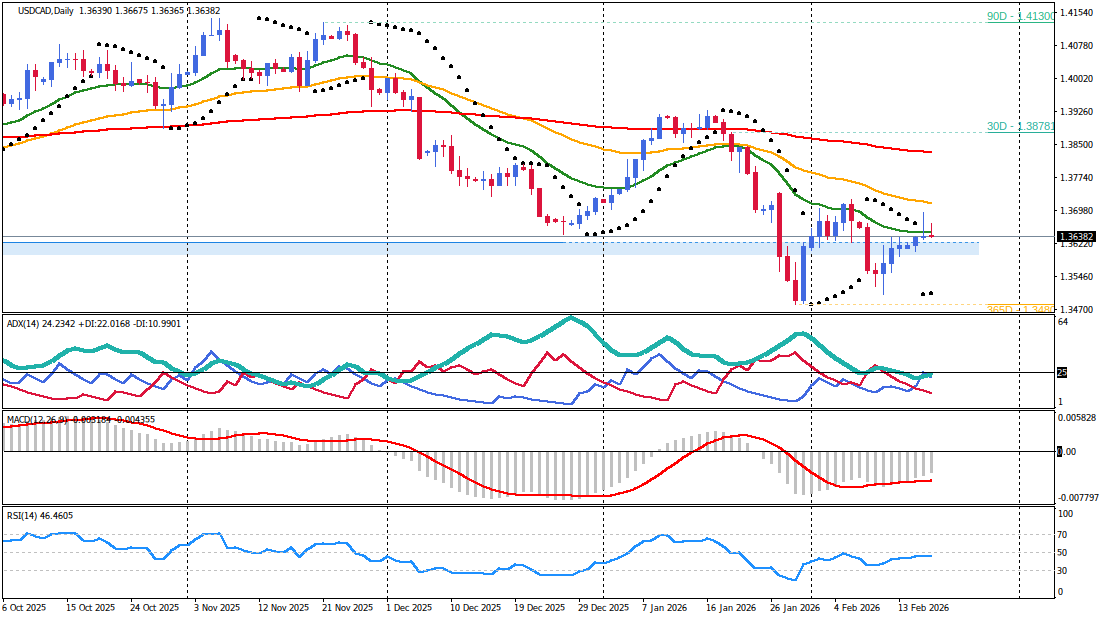
The dominant structure on the Daily (D1) timeframe remains firmly bearish. USD/CAD continues to trade significantly below the 200-day Exponential Moving Average (EMA) located at 1.3830, which serves as the ultimate arbiter of the long-term trend. The rejection of the 1.3690 zone in recent sessions, followed by a daily close near 1.3638, confirms that sellers are defending higher price levels. This fundamental lack of upward conviction suggests that the current six-day rally is corrective rather than a structural trend reversal.
On the H4 timeframe, medium-term momentum shows signs of stalling. Price action is currently testing the convergence of the EMA20 (1.3635) and EMA50 (1.3625). While the Average Directional Index (ADX) remains elevated at 48.60, the failure to penetrate the H4 EMA200 at 1.3692 indicates that the recovery phase is losing steam. A sustained break below the 1.3625 support cluster would align the medium-term timeframe with the bearish daily trend, potentially accelerating a move toward psychological support at 1.3600.
Critical Price Levels & Momentum Assessment
The intraday bias remains bearish as the pair forms a series of lower highs on the H1 chart. Price is currently pressured below the H1 EMA20 (1.3648). Although momentum oscillators such as the Stochastic (7.05) and RSI (37.10) indicate oversold conditions on the M30 timeframe, these signals often precede minor corrective bounces rather than full reversals. The technical framework highlights the following key levels:
- Resistance Levels:
- 1.3667: Intraday high and H1 Parabolic SAR alignment.
- 1.3692: H4 EMA200 and previous session peak; acts as a major structural barrier.
- 1.3714: D1 EMA50, representing the primary trend reversal point for long-term bulls.
- Support Levels:
- 1.3625: H4 EMA50 and H1 EMA200 confluence zone.
- 1.3600: Psychological level and previous consolidation base.
- 1.3580: Multi-week structural support level.
Fundamental Market Drivers
Central Bank Policy & Economic Outlook
The Bank of Canada is currently navigating a cooling inflationary environment. The CPI data released on February 17 revealed that headline inflation moderated to 2.3% in January, down from 2.4% in December. More critically for the BoC, the trimmed-mean core rate fell to 2.4%, its lowest level since April 2021. This progress in underlying inflation aligns with the BoC’s own forecasts and reinforces the expectation that the central bank will maintain the policy rate at 2.25% during its March 18 meeting. While food and restaurant prices saw temporary spikes due to the expiration of tax breaks, the sharp deflation in transportation (-17%) driven by gasoline prices provides the BoC with significant breathing room.
Price action aligns with the fundamental backdrop to favor a limited upside for the Loonie in the immediate term. The US Federal Reserve, conversely, remains in the spotlight with the upcoming release of the January meeting minutes. Divergence within the FOMC is expected to be a key theme, as some members signal the possibility of multiple rate cuts in 2026 while the official projection remains conservative for the current year. This policy disparity creates a ceiling for USD/CAD, as the market balances a softening Canadian economy against a resilient but uncertain US interest rate path.
Market Sentiment & Risk Environment
Market sentiment remains relatively subdued, partly due to recent holiday closures in Asian markets. However, the US Dollar has maintained a bid tone as investors prepare for high-impact US data releases in the latter half of the week. Risk-off sentiment, if triggered by hawkish FOMC minutes or strong US labor data, could provide a temporary floor for the pair. Conversely, the receding inflationary pressures in Canada suggest that the Loonie lacks the domestic catalysts required to stage a major independent rally. The technical rejection at 1.3692 reflects this fundamental equilibrium, where neither currency possesses enough momentum to break the established multi-month range.
Integrated Trading Execution
Primary Trading Scenario
- Bias: Bearish continuation based on H1 lower-high structure and D1 trend alignment.
- Trigger/Entry: Short entry on a retracement to the 1.3645 - 1.3655 zone (H1 EMA20) with bearish price action confirmation.
- Stop-Loss: 1.3675, placed above the intraday high and Parabolic SAR.
- Profit Targets:
- Target 1: 1.3625 - Confluence of H4 EMA50 and H1 EMA200.
- Target 2: 1.3605 - Proximity to the 1.3600 psychological support level.
- Session Context: Best executed during the New York session overlap, specifically leading into the FOMC Minutes release.
Alternative Market Scenario
- Invalidation: A clean break and sustained M30 close above the 1.3670 resistance level.
- Bias: Bullish reversal targeting medium-term structural resistance.
- Trigger/Entry: Buy entry at 1.3675 following a break of the intraday high, requiring a USD-positive catalyst from US durable goods or manufacturing data.
- Stop-Loss: 1.3650.
- Profit Targets:
- Target 1: 1.3692 - Retest of the critical H4 EMA200 barrier.
- Target 2: 1.3710 - Alignment with the D1 EMA50.
- Session Context: Likely to occur if FOMC Minutes reveal a more hawkish-than-expected stance or if US Advance GDP exceeds forecasts.
Risk Management & Catalyst Analysis
Trade Risk Assessment
The primary risk to the technical setup is the high-impact nature of today’s FOMC Minutes. Such events frequently cause "whipsaw" price action that can trigger stop-loss orders before the intended trend resumes. Traders should utilize the H1 Average True Range (ATR) of 0.00088 to set stop-loss buffers, maintaining at least a 1.5x ATR distance. Given the cluster of high-impact data scheduled for the remainder of the week, reducing position sizes by 50% prior to major releases is a prudent risk mitigation strategy. The H4 support at 1.3625 remains a significant obstacle; a failure to break this level with volume would suggest a transition into a broader consolidation phase.
Economic Calendar & Event Impact
- US Core Durable Goods Orders m/m (Today, 13:30 UTC): Forecast 0.3%, Previous 0.5% - Provides early insight into US manufacturing health and USD demand.
- US FOMC Meeting Minutes (Today, 19:00 UTC): No Forecast - High-impact catalyst for USD volatility and interest rate path clarity.
- US Unemployment Claims (Tomorrow, 13:30 UTC): Forecast 223K, Previous 227K - Critical indicator of labor market resilience affecting Fed policy.
- CA Core Retail Sales m/m (February 20, 13:30 UTC): Forecast -0.1%, Previous 1.7% - Key gauge of Canadian consumer strength and BoC policy implications.
- US Advance GDP q/q (February 20, 13:30 UTC): Forecast 3.0%, Previous 3.0% - Major driver for the broader USD trend and economic growth narrative.
- US Core PCE Price Index m/m (February 20, 13:30 UTC): Forecast 0.3%, Previous 0.2% - The Fed's preferred inflation metric; highly influential for market sentiment.
- US Flash Manufacturing & Services PMI (February 20, 14:45 UTC): Forecast 52.4/53.0 - Real-time assessment of US economic expansion or contraction.
Synthesized Market Outlook
The outlook for USD/CAD is one of cautious bearishness within a broader consolidation framework. The technical failure to surmount the H4 EMA200 at 1.3692, combined with the primary bearish trend on the daily chart, suggests that the path of least resistance remains to the downside. Fundamental drivers, specifically the cooling Canadian inflation at 2.3% and the anticipated BoC "hold" at 2.25%, provide a neutral base for the Loonie, leaving the pair's direction primarily in the hands of the US Dollar's reaction to upcoming Federal Reserve communications and tier-one economic data.
Traders should closely monitor the 1.3667 resistance and the 1.3625 support zone. A break below 1.3625, confirmed by a daily close, would signal a resumption of the long-term downtrend toward 1.3580. Conversely, any technical breakout above 1.3692 would require a substantial fundamental shift in US inflation or growth expectations to be considered sustainable. Until such a catalyst emerges, the technical structure favors selling into strength near intraday resistance levels.


