
USD/CAD is experiencing a robust short-term bullish correction, challenging critical H4 resistance levels even as lower timeframes indicate overbought conditions. This immediate upside momentum, however, unfolds against a dominant daily bearish trend for the pair, driven fundamentally by a softening US economy, the Federal Reserve's dovish policy stance, and a resilient Canadian Dollar supported by elevated oil prices and expectations of a more hawkish Bank of Canada. The upcoming high-impact US FOMC Meeting Minutes are the paramount catalyst, possessing the potential to either validate the current counter-trend rally if they surprise hawkishly, or more likely, to trigger a bearish reversal from resistance, aligning with the prevailing longer-term fundamental and technical biases for USD/CAD.
Technical Analysis
Multi-Timeframe Market Structure
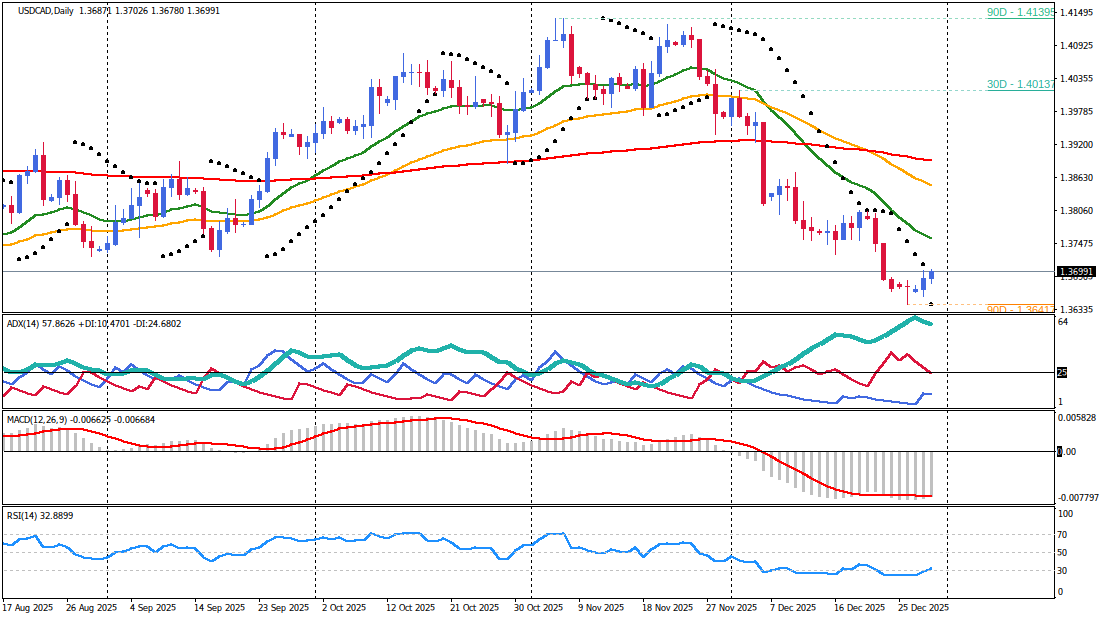
The dominant structure for USD/CAD remains decisively bearish on the daily (D1) timeframe. Price trades significantly below its EMA20 (1.37577), EMA50 (1.38493), and EMA200 (1.38930), all of which exhibit a downward slope, reinforcing the sustained bearish pressure on the US Dollar. The MACD histogram is deeply negative (-0.006581), confirming strong bearish momentum, while RSI at 34.19 indicates bearish pressure without being oversold. ADX at 56.86 signals a very strong trend with the -DI dominant. This daily bearish framework aligns with the fundamental narrative of persistent USD weakness throughout 2025 due to a softening US economic outlook and a dovish Federal Reserve. However, the Parabolic SAR (1.36417) is currently below price, suggesting a potential short-term bullish bounce is underway against this longer-term trend.On the medium-term H4 chart, price exhibits a strong counter-trend bullish momentum, trading above the EMA20 (1.36889) but below the EMA50 (1.37173) and EMA200 (1.38432). The MACD is negative (-0.000640) but shows signs of turning positive, while RSI at 54.26 indicates neutral-to-bullish momentum. Stochastic at 87.38 is in the overbought region, highlighting the extended nature of this rally. ADX at 31.88 confirms a strong trend is active. The SAR (1.36620) below price further confirms the current bullish push. This H4 bullish push represents a significant rebound from recent lows, contradicting the daily bearish sentiment, but is viewed as a corrective phase.
The short-term intraday (H1/M30) charts reinforce this immediate bullish bias. H1 price trades firmly above its EMA20 (1.36877) and EMA50 (1.36846), both sloping upwards. MACD is positive (0.000350) and rising, and RSI at 65.72 signals strong bullish sentiment. Stochastic at 78.94 is overbought, but ADX at 21.57 indicates a developing trend. The M30 chart further reinforces this, with price above its EMA20 (1.36901), EMA50 (1.36865), and EMA200 (1.36938). MACD is positive (0.000324) and RSI at 68.97, along with Stochastic at 93.83, confirms extremely overbought conditions. ADX on M30 at 34.43 shows a strong trend. The confluence of indicators across H1 and M30 points to a powerful intraday rally, but the extreme overbought readings suggest a high probability of a near-term pullback for consolidation or a reversal as the rally approaches H4 resistance.
Critical Price Levels & Momentum Assessment
The market is currently in a strong counter-trend rally, but it is approaching significant resistance levels that align with the broader bearish bias. The critical resistance cluster is formed by the H4 EMA50 at 1.37173 and the H1 EMA200 at 1.37211. A sustained break above this zone would signal a deeper correction against the daily trend, potentially targeting the D1 EMA20 at 1.37577, which acts as the first major daily resistance and the top of the short-term daily bearish channel. The ability of the pair to overcome this resistance cluster will be heavily influenced by the fundamental catalysts, particularly the upcoming FOMC minutes.Key support levels for the current bullish momentum include the M30 EMA200 at 1.36938, which acts as a crucial intraday dynamic floor, and the H4 EMA20 at 1.36889, providing strong short-term support. Further robust intraday support sits at the H1 EMA50 at 1.36846. A failure to hold these supports, especially after a potential rejection from resistance, would signal a resumption of the broader bearish trend.
Momentum quality is strong on H1/M30, driven by rising MACD, RSI, and ADX, but the overbought conditions on these lower timeframes suggest the rally is extended. ATR on H1 is 0.000716, indicating moderate intraday volatility, suitable for active trading. The market phase is a strong developing trend on intraday charts, but it exists within a larger D1 range-bound or transitional phase as it bounces from a low. Signal confluence for the bullish rally is high on the intraday charts, but it conflicts with the higher timeframe bearish bias, leading to a medium overall confidence in sustained upside.
Fundamental Market Drivers
Central Bank Policy & Economic Outlook
The US Dollar has been one of the weakest performers among major currencies in 2025, set to close the year approximately 20% lower against the Canadian Dollar. This significant depreciation is fundamentally driven by a softening US economic backdrop, the erratic trade policies of US President Trump, and a notable monetary policy divergence between the Federal Reserve and the Bank of Canada.The Federal Reserve implemented a 25 basis point rate cut in December 2025 and hinted at another rate cut in 2026. The upcoming FOMC Meeting Minutes are expected to reflect a wide divergence among committee members, which fuels market expectations of a deeper easing cycle in 2026. Furthermore, US President Trump's stated preference for radically lower interest rates as a prerequisite for the next Fed chair, whose term concludes in May, underscores the persistent dovish bias influencing the US central bank's future trajectory. This dovish Fed outlook provides a strong fundamental headwind for the US Dollar, reinforcing the daily bearish bias on USD/CAD.
In contrast, the Bank of Canada (BoC) is perceived to be on a different path. Scotiabank's "Canadian Rates Outlook 2026" suggests the BoC's next monetary move is a hike. Relatively higher interest rates from the BoC tend to be positive for the CAD, attracting capital inflows and increasing demand for the currency. The BoC's primary goal of maintaining inflation at 1-3% by adjusting interest rates implies a readiness to tighten policy if economic conditions warrant, further supporting the Canadian Dollar against a dovish Fed.
Market Sentiment & Risk Environment
The Canadian Dollar is currently drawing some support from a moderate uptick in Oil prices, which is Canada’s main export. The fading hopes of an upcoming peace agreement in Russia and escalating tensions with Iran are likely to maintain sanctions on two of the world’s major Crude exporters. This geopolitical backdrop eases concerns of overproduction in 2026, leading to higher oil prices. As petroleum is Canada’s biggest export, a rise in oil prices generally increases aggregate demand for the CAD, contributing to its strength and supporting the daily bearish outlook for USD/CAD. Higher oil prices also tend to result in a greater likelihood of a positive Trade Balance for Canada, which is additionally supportive of the Loonie.Market sentiment, specifically whether investors are taking on more risky assets (risk-on) or seeking safe-havens (risk-off), also influences the CAD, with risk-on environments generally being CAD-positive. The health of the US economy, as Canada's largest trading partner, remains a key influencing factor. A strong US economy would typically support Canadian exports, but the current softening trend in the US economy, coupled with trade policy uncertainties, has contributed to the USD's underperformance.
Integrated Trading Execution
Primary Trading Scenario
- Bias: Bullish (Counter-Trend Pullback Entry) - Medium probability of continuation after a retracement, within a larger bearish structure. This scenario aligns with the immediate technical momentum but faces fundamental headwinds at higher resistance.
- Trigger/Entry: Buy limit at 1.36915 (±3 pips) on a confirmed M30 bullish candle from the 1.36930-1.36900 support zone (M30 EMA200 / H4 EMA20 confluence). This entry capitalizes on the strong intraday bullish momentum following a healthy pullback, but traders must acknowledge the underlying daily bearish trend and the significant event risk.
- Stop-Loss: 1.36750 (below H1 EMA50, approximately 1.25x H1 ATR from entry). This stop-loss accounts for intraday volatility and positions below a key short-term support, with the understanding that a break below this level would signal a deeper correction or reversal.
- Profit Targets:
- Target 1: 1.37150 (just below H4 EMA50/H1 EMA200 resistance cluster). This target acknowledges the strong resistance zone that aligns with the broader bearish fundamental outlook for USD.
- Target 2: 1.37350 (extension towards D1 EMA20). This higher target represents a more aggressive extension of the counter-trend rally, requiring significant bullish conviction to overcome the formidable resistance posed by the 1.37173-1.37211 cluster, which is fundamentally challenged by a dovish Fed.
- Session Context: This scenario is best executed during the London/NY overlap, capitalizing on current momentum. However, it requires extremely tight monitoring due to the imminent release of the high-impact FOMC minutes.
Alternative Market Scenario
- Invalidation: A sustained M30 close above 1.37250 invalidates this bearish alternative, suggesting the counter-trend rally has more strength than anticipated and aims for higher daily resistance.
- Bias: Bearish (Reversal from Resistance) - This scenario aligns with the dominant daily bearish trend and the fundamental drivers of USD weakness and CAD strength.
- Trigger/Entry: Sell entry at 1.37170 (±3 pips) upon a confirmed M30 bearish engulfing or pin bar reversal from the 1.37173-1.37211 resistance zone. A clear rejection here would signal that the fundamental drivers of USD weakness are asserting themselves against the technical counter-trend rally.
- Stop-Loss: 1.37300 (above the high of the reversal candle, approximately 1.25x H1 ATR from entry).
- Profit Targets:
- Target 1: 1.36850 (retest of H1 EMA50 support). This target represents a move back towards intraday supports, validating the reversal from resistance.
- Target 2: 1.36600 (towards H4 SAR). This deeper target would indicate a stronger resumption of the daily bearish trend, potentially catalyzed by dovish FOMC minutes.
- Session Context: This scenario could develop late in the NY session or post-FOMC minutes if the event triggers a reversal, especially if the minutes reinforce the Fed's dovish stance.
Risk Management & Catalyst Analysis
Trade Risk Assessment
The confluence quality for USD/CAD is currently medium. While intraday timeframes show strong bullish alignment, this directly conflicts with the dominant bearish trend on the daily chart, a trend well-supported by fundamental factors such as the Fed's dovish policy and the CAD's strength from oil prices and hawkish BoC expectations. The extreme overbought conditions on H1/M30 add to the risk of a sharp pullback or reversal, increasing the inherent volatility of the current market structure.The proximity of high-impact US FOMC Meeting Minutes within the next few hours significantly increases event risk. Volatility during the London/NY overlap can lead to whipsaws, and the extreme overbought conditions on shorter timeframes imply a higher risk of immediate retracement before or after the minutes. Position sizing should be conservative, with stops widened to account for potential event-driven spikes. Within four hours of the FOMC Meeting Minutes, position size for any new trades must be reduced by 50%. Existing trades require close monitoring or scaling back to mitigate potential sharp price movements. The primary bullish scenario is highly time-sensitive; its validity diminishes significantly after the FOMC Meeting Minutes release, which could either confirm or invalidate the current rally.
Economic Calendar & Event Impact
The upcoming economic calendar features several high-impact events that will significantly influence USD/CAD direction, particularly focusing on US data:- US FOMC Meeting Minutes (Today, 19:00 UTC): High-impact event for USD direction. The minutes are expected to reflect divergence among committee members regarding the Fed's rate cut in December and future easing, which could amplify market expectations for a deeper easing cycle in 2026. A dovish tone would likely reinforce USD weakness, potentially triggering a bearish reversal for USD/CAD from current resistance.
- US Unemployment Claims (Tomorrow, 13:30 UTC): Forecast 217K, Previous 214K - A key labor market indicator with significant market impact potential for the USD. A higher-than-forecast reading would signal a weakening labor market, supporting the Fed's dovish stance and contributing to USD weakness. Conversely, a lower reading could provide temporary USD support.
Synthesized Market Outlook
USD/CAD is navigating a complex landscape where strong intraday bullish momentum, driven by a short-term counter-trend rally, clashes with a dominant daily bearish trend reinforced by a dovish Federal Reserve and a fundamentally supported Canadian Dollar. The pair's immediate trajectory hinges on its interaction with the critical resistance cluster around 1.37173-1.37211, especially as it approaches the high-impact US FOMC Meeting Minutes.The fundamental backdrop of a softening US economy, coupled with the Fed's easing bias and President Trump's preference for lower rates, creates a persistent headwind for the US Dollar. Conversely, the Canadian Dollar benefits from a moderate uptick in oil prices due to geopolitical tensions and the Bank of Canada's comparatively more hawkish stance, with Scotiabank anticipating a rate hike. This fundamental divergence strongly supports a long-term bearish outlook for USD/CAD.
Therefore, while the primary trading scenario attempts to capitalize on a short-term bullish pullback, traders must remain acutely aware that this move is a correction against a more powerful, fundamentally-driven downtrend. The alternative bearish reversal scenario, triggered by a clear rejection from the 1.37173-1.37211 resistance zone, aligns perfectly with the prevailing daily technical structure and the overarching fundamental narrative of USD weakness. The FOMC minutes are the critical catalyst that could either provide a short-lived boost to the USD if they surprise hawkishly, or more likely, cement expectations for deeper easing, thus accelerating a bearish reversal for USD/CAD. Monitoring the 1.37173-1.37211 resistance zone for signs of rejection post-FOMC minutes is paramount for confirming the resumption of the broader bearish trend.


