
AUD/USD currently consolidates within a tight range, reflecting a neutral to slightly bearish intraday bias after a strong daily uptrend. The underlying narrative for the pair remains firmly anchored in the widening policy divergence between a hawkish Reserve Bank of Australia and an increasingly dovish Federal Reserve. While daily technicals signal robust bullish momentum, short-term price action indicates profit-taking and uncertainty as traders await high-impact US economic data, particularly the FOMC Meeting Minutes and Unemployment Claims. This fundamental backdrop supports the potential for continued AUD outperformance against a structurally weaker US Dollar, though immediate tactical entries require confirmation post-catalyst.
Technical Analysis
Multi-Timeframe Market Structure
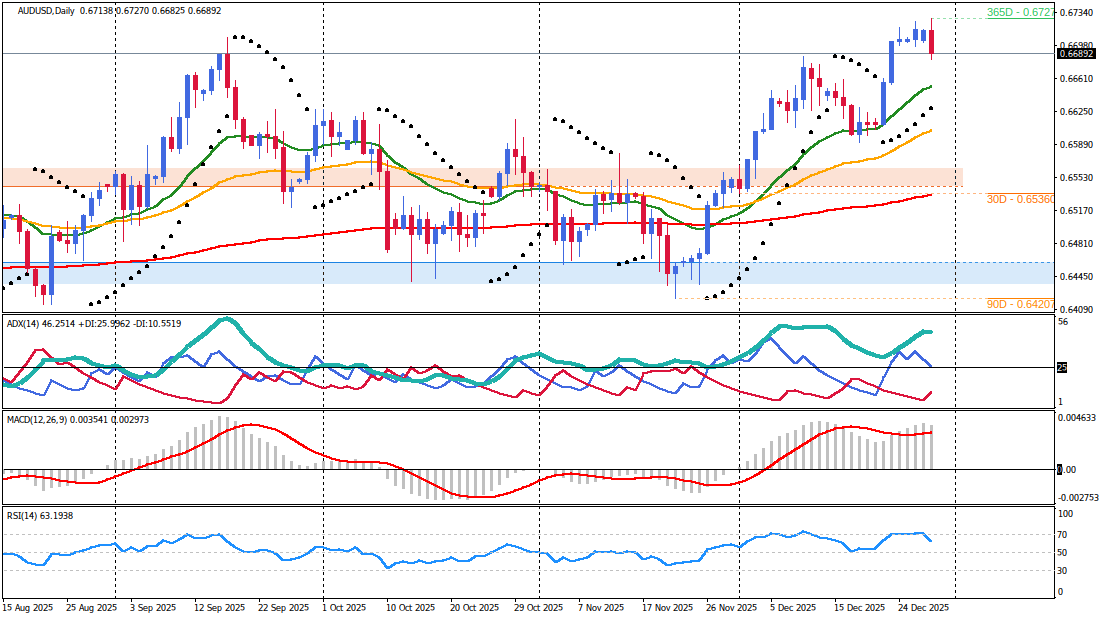
The daily timeframe for AUD/USD exhibits a robust uptrend, with price closing strongly bullish on December 28th. This is confirmed by price trading well above all key Exponential Moving Averages (EMA20 at 0.66534, EMA50 at 0.66046, and EMA200 at 0.65344), which are bullishly aligned. The MACD is positive and rising, and ADX at 46.25 confirms strong trend strength. This strong daily bullish structure finds fundamental support from the Reserve Bank of Australia's accelerating interest rate hike path and rising Australian inflationary pressures, which bolster the Australian Dollar's long-term trajectory. However, the Stochastic at 86.43 in overbought territory suggests the potential for a deeper correction, which aligns with the current intraday pullback.On the H4 chart, the medium-term view shows price consolidating just below the EMA20 (0.66975) after a recent pullback. While EMAs maintain their bullish alignment, MACD shows positive but flattening momentum, indicating a pause in the bullish drive. Stochastic at 26.74 is oversold, hinting at the potential for a bounce, but the Parabolic SAR at 0.67229 has flipped above price, suggesting the short-term trend is in question or reversing within this timeframe. This H4 consolidation reflects the market's wait-and-see mode ahead of critical US data, despite the underlying AUD strength.
The H1 chart shows immediate bearish momentum, with price trading below the EMA20 (0.66980) and EMA50 (0.67008). MACD is negative and declining, and RSI at 40.62 indicates bearish pressure. However, the M30 timeframe shows signs of stabilization, with price hovering near its EMA20 (0.66937) and Stochastic rising from oversold. The ADX on M30 at 12.73 points to ranging conditions, reflecting the thin holiday trading volume and defensive positioning. The immediate bias is for continued consolidation or a slight bearish edge, but with limited conviction given the ranging M30 and the higher timeframe bullish context.
Critical Price Levels & Momentum Assessment
Resistance:- 0.66980-0.67010 (H1 EMA20 & EMA50 confluence, psychological resistance) - A break above this level is critical for intraday bullish momentum to resume, aligning with underlying AUD strength.
- 0.67054 (H1 Parabolic SAR)
- 0.67155 (Previous D1 high) - Clearance of this level confirms renewed bullish conviction, potentially driven by further USD weakness post-FOMC minutes.
- 0.66900-0.66905 (Intraday H1/M30 low confluence, psychological support) - Holding this level is crucial for the daily uptrend to remain intact against intraday selling pressure.
- 0.66874 (M30 Parabolic SAR)
- 0.66534 (D1 EMA20) - This strong daily support level represents a key area where the underlying RBA hawkishness is expected to provide fundamental bids, limiting downside corrections.
Fundamental Market Drivers
Central Bank Policy & Economic Outlook
The primary fundamental driver for AUD/USD is the significant and widening divergence in monetary policy trajectories between the Reserve Bank of Australia (RBA) and the Federal Reserve (Fed). The RBA is on a path toward accelerating interest rate hikes, a stance bolstered by rising Australian inflationary pressures, with the Australian Monthly Consumer Price Index (CPI) growing at an annualized pace of 3.8% in November. This hawkish RBA outlook provides robust fundamental support for the Australian Dollar, contributing significantly to the pair's dominant daily uptrend and its recent outperformance against major currencies.In stark contrast, the Federal Reserve is trapped in a downward spiral, having already trimmed interest rates for a third straight meeting in 2025, lowering the fed funds rate to 3.50%-3.75%. Global markets broadly expect a further dovish tilt from Fed officials. The Fed's own dot plot projects a moderate easing pace in 2026, with median clusters calling for two interest rate cuts over the next two years. However, rate traders, as per the CME FedWatch Tool, are pricing in an even more aggressive schedule, anticipating at least two interest rate cuts from the Fed before the end of September 2026, with further easing expected thereafter. This dovish Fed stance structurally weakens the US Dollar and reinforces the bullish bias for AUD/USD, as widening interest rate differentials make the AUD more attractive.
Furthermore, improving global growth prospects threaten USD support in 2026. The World Citigroup Economic Surprise Index has extended its upward trend, reaching a 20-month high, indicating that global economic data consistently outperforms expectations. Stronger global growth is likely to encourage greater capital allocation toward non-US assets, including the AUD, and may also lead developed-market central banks like the RBA to pause their rate-cut cycles or even continue hiking, potentially pushing their sovereign bond yields higher. This narrowing of the US Treasury yield premium creates a negative feedback loop for the US dollar, aligning with the technical bullish continuation signals observed in AUD/USD.
Market Sentiment & Risk Environment
The current market sentiment is characterized by a year-end slowdown and dry-up in trading volume, leading to defensive positioning among traders. Despite this short-term tepidness, the underlying drivers are not expected to shift significantly heading into 2026. The defining narrative of 2025, a tug-of-war between "US exceptionalism" and "US debasement," saw the US Dollar Index end the year down approximately 10.3%. Non-US currencies, including the AUD, broadly outperformed the USD, supported by portfolio rebalancing and commodity dynamics.A significant structural headwind for the US Dollar is the turning point in US liquidity. The US Net Liquidity Indicator, which historically shows an inverse relationship with the US Dollar Index, has rebounded following the Fed's announcement of the end of Quantitative Tightening (QT) effective December 1, 2025, and an unexpected restart of Treasury buybacks. If the Fed continues its Treasury bill buyback program, net liquidity is likely to rise further, increasing downside risks for the US dollar. This easing of liquidity conditions fundamentally supports a weaker USD environment, aligning with the broader bullish outlook for AUD/USD. The "risk-on" sentiment implied by improving global growth also tends to be positive for the Australian Dollar, a commodity-linked currency.
Integrated Trading Execution
Primary Trading Scenario
- Bias: Bullish Reversal - The strong daily uptrend, underpinned by a hawkish RBA and dovish Fed, suggests that the current intraday pullback is a consolidation phase before continuation.
- Trigger/Entry: A sustained break above 0.67010 (H1 EMA50 and psychological level) on H1, confirming an intraday bullish reversal. Look for M30 candle close above this level, ideally supported by dovish FOMC minutes.
- Stop-Loss: Place at 0.66870 (below H1/M30 lows and M30 SAR, approximately 1.5x H1 ATR from entry). This stop placement respects immediate intraday support and provides protection against whipsaws before the fundamental catalysts fully play out.
- Profit Targets:
- Target 1: 0.67150 (Previous D1 high and H4 SAR zone) - This level represents a key psychological and technical hurdle, where profit-taking may occur.
- Target 2: 0.67300 (Psychological level) - A break above this level indicates a strong resumption of the daily uptrend, fueled by continued USD weakness and RBA hawkishness.
- Session Context: This scenario is more likely to play out during the London or early NY session tomorrow if positive sentiment emerges, or after the FOMC minutes if they are perceived as dovish, validating the underlying fundamental divergence.
Alternative Market Scenario
- Invalidation: Price holds above 0.66900.
- Bias: Continued Bearish Intraday - Short-term profit-taking and low liquidity could extend the intraday correction, especially if upcoming US data provides unexpected USD support.
- Trigger/Entry: A decisive break below 0.66900 (confluence of H1/M30 lows and psychological level) on H1, confirmed by M30 candle close below. This breakdown would signal a temporary dominance of selling pressure.
- Stop-Loss: Place at 0.66980 (above H1 EMA20 and intraday resistance, approximately 1.5x H1 ATR from entry).
- Profit Targets:
- Target 1: 0.66800 (Psychological level)
- Target 2: 0.66530 (D1 EMA20) - This is a strong daily support level where fundamental bids for AUD are expected to emerge, potentially limiting further downside.
- Session Context: This scenario could unfold during the low-liquidity Asian session if bearish momentum from NY close extends, or if early European news weighs on the AUD. This scenario is vulnerable to any hawkish surprises from the FOMC minutes that could temporarily boost the USD.
Risk Management & Catalyst Analysis
Trade Risk Assessment
The confluence quality for AUD/USD is currently medium. The strong daily bullish trend, fundamentally supported by RBA's hawkish stance and the Fed's dovish pivot, is in conflict with immediate intraday bearish momentum and ranging conditions. This creates mixed signals that demand cautious positioning. Proximity to high-impact USD events, specifically the FOMC Meeting Minutes tomorrow and US Unemployment Claims on December 31st, significantly increases event risk. Trading in the late NY session, transitioning into low-liquidity Asian hours, further increases the risk of whipsaws and false breaks. The upcoming high-impact events pose a substantial risk of sudden, sharp moves that could quickly invalidate technical levels. Due to these mixed signals and high event risk, consider reducing standard position size by 50%. For intraday entries, use a stop-loss of 1.25x H1 ATR (approximately 12 pips) under normal conditions, but widen to 2x ATR (18 pips) if trading around event times or during volatile overlaps to account for increased market choppiness. Any intraday technical setups have limited validity given the imminent high-impact economic events.Economic Calendar & Event Impact
The upcoming economic calendar features several high-impact events that will significantly influence AUD/USD direction, primarily driven by their impact on the US Dollar:- US Pending Home Sales m/m (Today, 15:00 UTC): Forecast 1.0%, Previous 1.9% - A weaker-than-expected reading could reinforce the dovish Fed narrative, potentially supporting AUD/USD.
- US FOMC Meeting Minutes (Tomorrow, 19:00 UTC): High-impact event for USD direction - This is the most critical event. Any indications of a more aggressive rate-cutting path or increased concern over the labor market will reinforce the dovish Fed expectations, driving USD weakness and supporting AUD/USD. Conversely, any surprisingly hawkish dissent could provide temporary USD strength, challenging the primary bullish scenario.
- US Unemployment Claims (December 31, 13:30 UTC): Forecast 215K, Previous 214K - A higher-than-forecast number would signal a weakening US labor market, aligning with the Fed's dovish pivot and potentially weighing on the USD, thus supporting AUD/USD. A significantly lower number could offer temporary USD reprieve.


