
The USD/CAD pair is currently navigating a short-term consolidation phase, influenced by a blend of political uncertainties, mixed economic data, and anticipation of key central bank signals. While the daily chart indicates a robust bullish trend, shorter timeframes reveal indecision and ranging behavior around critical moving averages. US President Trump's recent comments regarding potential tariffs and renegotiated trade deals with Canada introduce a layer of geopolitical risk, even as a meeting between PM Carney and President Trump has reportedly boosted North American currencies. Concurrently, a US government shutdown and dovish Federal Reserve rate cut expectations are weighing on the US Dollar, contrasting with a balanced Bank of Canada outlook and recovering oil prices, which could lend some support to the Canadian Dollar. The market is poised for significant volatility, with a packed economic calendar this week expected to provide the next directional catalysts for the pair.
Recent Market Performance Analysis
Price Action Summary
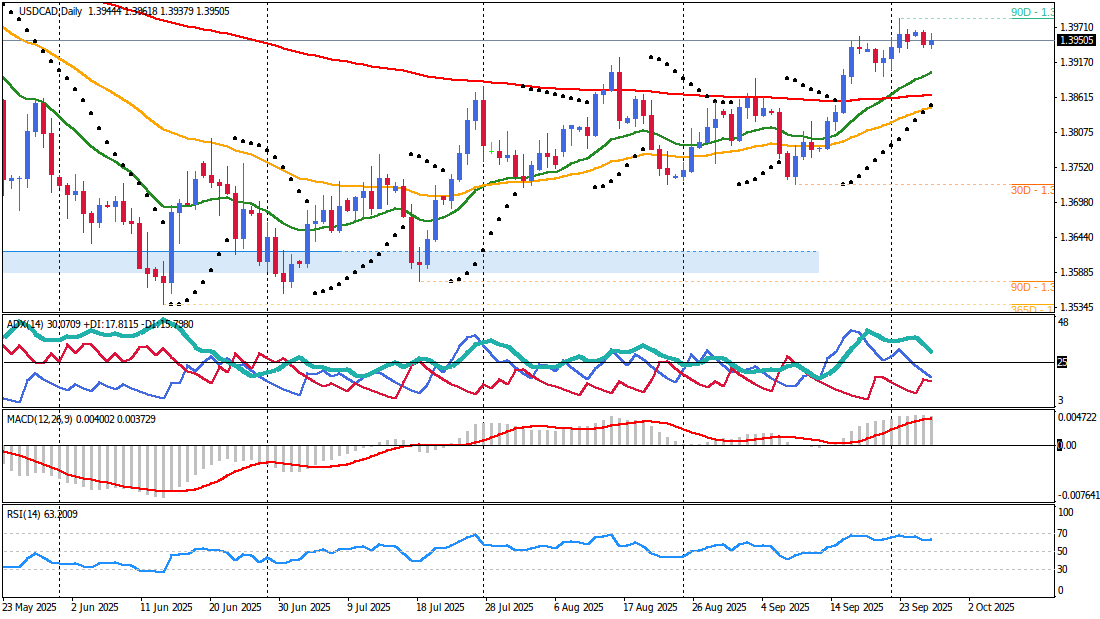
The USD/CAD pair has entered a short-term consolidation phase following a significant bullish trend observed on the daily timeframe. Price action on shorter timeframes, specifically H4, H1, and M30, indicates a lack of strong directional conviction, with the pair ranging around immediate moving averages. On the daily chart, the price trades significantly above the EMA20 (1.38953), EMA50 (1.38427), and EMA200 (1.38646), affirming a strong and established bullish trend. However, the H4 chart shows price slightly below its EMA20 (1.39497), while the H1 and M30 charts reveal price trading below their respective EMA20 and EMA50, signaling short-term bearish pressure or consolidation. This divergence highlights a pause in the immediate upward drive, with momentum indicators on shorter timeframes weakening or turning negative. The pair has been observed consolidating in a triangle formation on the 4-hour chart, suggesting a potential breakout as prices converge. Resistance near the 1.40 psychological level has been a notable barrier, with sellers appearing at the 200-Day Moving Average (1.3983).Fundamental Drivers Assessment
Recent fundamental developments have presented a mixed picture for both the US Dollar and the Canadian Dollar. On the US side, the ongoing government shutdown, now in its eleventh day, continues to pressure the US Dollar, with analysts warning of potential economic losses if no resolution is reached. This political impasse has also delayed the release of crucial economic data, including the September Nonfarm Payrolls report. The Federal Reserve's monetary policy outlook appears dovish, with CME FedWatch indicating a 92% probability of a 25 basis point rate cut at the FOMC meeting on October 29, and an 81% probability of another cut in December. This suggests the Fed may prioritize growth stability over inflation concerns, potentially weakening the USD.For Canada, economic data has been somewhat inconsistent. While the August International Merchandise Trade registered a deficit of $-6.32 billion, falling below expectations of $-5.55 billion, and exports dipped from $61.86 billion to $60.58 billion, the September Ivey Purchasing Managers Index (s.a.) came in above expectations at 59.8 versus a forecast of 51.2. The Bank of Canada (BoC) maintains a balanced outlook, with easing inflation and slowing growth pressuring policymakers towards easing. However, markets are pricing in a 55% probability of a 25 basis point cut in October. The narrowing interest rate differential between Ottawa and Washington could potentially favor the Canadian Dollar in the medium term. Additionally, recovering oil prices, following OPEC's decision to slightly increase production for November, have boosted demand for the Loonie.
A significant geopolitical factor influencing the pair is US President Trump's recent commentary regarding trade relations with Canada. Trump expressed the need for a "better trade deal" and spoke of tariffs with Canada, including on steel and aluminum, despite having crafted the USMCA deal during his first term. While these comments introduce uncertainty and a "natural business conflict," the meeting between Canada's Prime Minister Carney and President Trump has reportedly led to improved prospects, helping both the US Dollar and Canadian Dollar strengthen against their peers. The outcome of these trade discussions, particularly concerning key commodities and sectors like dairy, could significantly impact the Canadian economy and, by extension, the CAD.
Technical Analysis
The USD/CAD pair is currently consolidating within a broader bullish trend, with conflicting signals across different timeframes. The market condition is characterized by short-term indecision, largely attributable to the anticipation of high-impact economic events.Critical Price Levels
* Resistance: * 1.39590-1.39600: Represents a recent high and H1 SAR, a critical short-term resistance. * 1.39670: Identified as H4 SAR and a previous price action high, indicating a stronger resistance point. * 1.39710-1.39720: Corresponds to the H4 Bollinger Upper Band, suggesting potential for price exhaustion at this level. * 1.3983: The 200-Day Moving Average, acting as a significant barrier on the daily chart. * 1.4000-1.4014: A major psychological level and cluster resistance, encompassing the 38.2% retracement of the 1.4791 to 1.3538 move (1.4017). A sustained break above this level would have larger bullish implications. * 1.4050: April 3 lows, representing another resistance level from previous price action. * Support: * 1.39490-1.39500: A tight confluence zone including the H4 EMA20 and M30 EMA200, acting as immediate support. * 1.39420-1.39440: A strong support zone comprising the D1 SAR, D1 Bollinger Middle, and a previous swing low. * 1.3925: Identified as the August 22 highs and a current pivot level. A close below this could confirm a deeper retracement. * 1.39300-1.39310: The H4 EMA50, serving as a medium-term support. * 1.3850-1.3860: A significant support zone, also marking the upper bound of the August consolidation range (1.3720 to 1.3880). * 1.3725: A key support level where a turn in bias to the downside could occur if 1.3895 is breached. * 1.3550: Main 2025 support, representing a long-term critical level.Trend Structure, Momentum, and Chart Patterns
The multi-timeframe analysis reveals a nuanced market structure. The Primary Trend Assessment (D1) confirms a strong bullish trend, with price trading well above the EMA20, EMA50, and EMA200. The MACD is positive and robust at 0.004070, while the RSI at 62.37 indicates strong buying momentum without being extremely overbought. The ADX at 33.78 further affirms this strong trend.However, the Medium-term Framework (H4) shows a pause or minor retracement within this broader uptrend. Price is slightly below the EMA20 (1.39497) but still above EMA50 (1.39306) and EMA200 (1.38590). MACD is positive but weaker at 0.000434, RSI is neutral at 51.24, and ADX is low at 16.29, indicating a lack of strong directional conviction.
The Short-term Direction (H1) and Intraday Perspective (M30) reinforce this consolidation, exhibiting short-term bearish pressure. On H1, price is below EMA20 (1.39506) and EMA50 (1.39510), with a negative MACD at -0.000034 and RSI at 48.26. M30 mirrors this with price below EMA20 (1.39504) and EMA50 (1.39508), and a negative MACD at -0.000053. ADX on both H1 and M30 are low (16.67 and 15.93, respectively), confirming a ranging or weak market.
The overall Momentum Indicator Synthesis points to a moderate momentum quality. The strong daily bullish MACD contrasts with weakening or negative MACD on shorter timeframes, suggesting a loss of immediate upward drive. RSI levels are generally neutral, reflecting the current consolidation. The market is categorized as being in a Ranging/Transitional phase on shorter timeframes, set within a Strong Trend on the daily chart. The current ATR (14) on H1 is 0.000894 (approximately 9 pips), indicating moderate intraday volatility, but this is expected to expand with upcoming events. A triangle formation on the 4-hour chart further accentuates the odds of a breakout as prices converge.
Forward-Looking Market Forecast
Upcoming Economic Calendar Events
The upcoming economic calendar is heavily weighted with high-impact events for both the US Dollar and Canadian Dollar, particularly between October 8th and October 10th. These events are expected to introduce substantial volatility and could dictate the pair's next directional move.* US FOMC Meeting Minutes (October 8, 18:00 UTC): High impact. This release will provide crucial insights into the Federal Reserve's monetary policy outlook and potential future rate path, significantly influencing USD strength. * US Unemployment Claims (October 9, 12:29 UTC and 12:33 UTC): High impact. These reports will offer a real-time gauge of the US labor market's health. The forecast for the 12:33 UTC release is 233K. * CA Employment Change (October 10, 12:30 UTC): High impact. Expected to show a change of 2.8K, a significant improvement from the previous -65.5K. A positive surprise could boost the CAD. * CA Unemployment Rate (October 10, 12:30 UTC): High impact. Forecast to increase slightly to 7.2% from the previous 7.1%. * US Average Hourly Earnings m/m (October 10, 12:32 UTC): High impact. Forecast at 0.3%, matching the previous reading. Wage growth is a key inflation indicator. * US Non-Farm Employment Change (October 10, 12:32 UTC): High impact. Forecast at 52K, a notable increase from the previous 22K. A strong reading could bolster the USD. * US Unemployment Rate (October 10, 12:32 UTC): High impact. Forecast to remain stable at 4.3%. * US Prelim UoM Consumer Sentiment (October 10, 14:00 UTC): High impact. Forecast at 54.6, a slight decline from the previous 55.4. * US Prelim UoM Inflation Expectations (October 10, 14:00 UTC): High impact. Previous reading was 4.8%. This report provides insight into consumer inflation outlook.
Bullish Scenario Analysis
A bullish continuation for USD/CAD appears to have a medium probability, contingent on specific fundamental and technical triggers. If upcoming economic data, particularly the US FOMC Meeting Minutes or US labor market reports on October 10th, are interpreted as overwhelmingly USD-positive or CAD-negative, it may provide the necessary catalyst for a breakout from the current consolidation. A clear break and sustained close above the 1.39600 resistance, potentially triggered by strong US Non-Farm Employment Change or hawkish insights from FOMC minutes, could signal a resumption of the primary daily bullish trend. A retest of this level as support would offer further confirmation. Under this scenario, the price could target the 1.39710 (H4 Bollinger Upper Band), followed by 1.39850 (previous swing high). A sustained break above the 200-Day Moving Average at 1.3983 and the psychological 1.4000 level, potentially fueled by renewed trade uncertainties or a significant interest rate differential shift in favor of the USD, could then lead to a test of the 1.4014 cluster resistance. If this cluster resistance is decisively breached, the pair might extend gains towards the 1.4050 (April 3 lows) and potentially higher towards 1.4200, as suggested by the daily technical outlook if it stays above 1.4000.Bearish Scenario Analysis
An alternative scenario involves a deeper retracement or extended consolidation, also with medium probability, especially if fundamental data proves USD-negative or CAD-positive. Failure to break above the 1.39600 resistance, coupled with a sustained close below the immediate support at 1.39490 (H4 EMA20, M30 EMA200 confluence), could trigger short-term bearish momentum. This might occur if the FOMC minutes are perceived as more dovish than anticipated, or if Canadian employment figures surprise positively, indicating a strengthening labor market. A sustained break below 1.39490 could lead to a retest of the stronger support zone around 1.39420-1.39440 (D1 SAR, D1 Bollinger Middle). If this critical support fails to hold, the pair might extend its decline towards 1.39300 (H4 EMA50) and potentially the 1.3925 pivot level. A close below 1.3925 could confirm a thesis of re-entering the August range, with subsequent targets at 1.39150 (previous significant low) and eventually the 1.3850-1.3860 support zone. Further weakness could potentially drive the pair towards 1.3725, invalidating the current upward bias from 1.3538.Key Risk Factors and Market Sentiment
The most significant risk factor for USD/CAD in the immediate term is the upcoming cluster of high-impact economic events from both the United States and Canada. These releases, particularly the US FOMC Meeting Minutes and the comprehensive labor market reports from both nations on October 10th, have the potential to introduce extreme volatility and completely override existing technical patterns. The current divergence between the strong daily bullish trend and the short-term consolidation on hourly charts also poses a risk, as the market is in an indecisive phase prone to whipsaws ahead of clear catalysts.Political developments surrounding US-Canada trade relations, stemming from President Trump's comments on tariffs and the ongoing renegotiation discussions, represent another layer of uncertainty. While the recent meeting between Carney and Trump reportedly boosted sentiment, the details of any "better deal" and potential tariffs on key sectors like steel, aluminum, and dairy remain unclear, potentially introducing further volatility for the Canadian Dollar. The continued US government shutdown also adds to market fragility, with its potential economic impact and the Federal Reserve's response remaining a key sentiment driver. Liquidity conditions around these high-impact event releases could also amplify price movements, making tight risk management paramount.
Trading Conclusion and Outlook Summary
The USD/CAD pair is at a critical juncture, with a strong underlying daily bullish trend temporarily paused by short-term consolidation and significant event risk. The overall bias is neutral/ranging with medium confidence, reflecting the mixed technical signals and the heavy economic calendar ahead.Key levels to monitor are the immediate resistance zone around 1.39590-1.39600 and the more formidable cluster resistance at 1.4000-1.4014. On the downside, critical support lies at 1.39490-1.39500, followed by the robust zone of 1.39420-1.39440.
The market's direction over the coming days will likely be determined by the outcome and interpretation of the US FOMC Meeting Minutes on October 8th, followed by a barrage of US and Canadian labor market data on October 10th. A stronger-than-expected US Non-Farm Employment Change or hawkish FOMC signals could potentially drive a breakout above 1.4000. Conversely, a dovish Fed stance or surprisingly strong Canadian employment figures could prompt a deeper retracement towards 1.3925 or even 1.3850. Given the heightened event risk and conflicting time-frame signals, prudent risk management and potentially reduced position sizing are advisable. Traders should remain highly reactive to incoming fundamental data, as it is expected to be the primary driver dictating the pair's next sustained move.


